Stakeholder Engagement Methods

A bilingual survey and targeted outreach and engagement with the agricultural sector was undertaken to inform development of agriculture-focused climate indices, case studies, and data formats for ClimateData.ca. This page provides an overview of the process of audience definition and priorities for climate information of those consulted through this process.

Overview

With the objective of expanding available content on ClimateData.ca, the Prairie Climate Centre, Canadian Centre for Climate Services, Ouranos, and the Pacific Climate Impacts Consortium worked together to engage the agricultural sector. A core objective of ClimateData.ca is to provide information and data to inform adaptation in key sectors. During initial engagement with the agricultural sector, a broad cross-section of the sector was engaged, followed by more targeted engagement for adaptation professionals. Initial engagement followed the approach spearheaded by Ouranos to engage the health sector.

Stakeholder Engagement Strategy for the Agriculture Sector Module

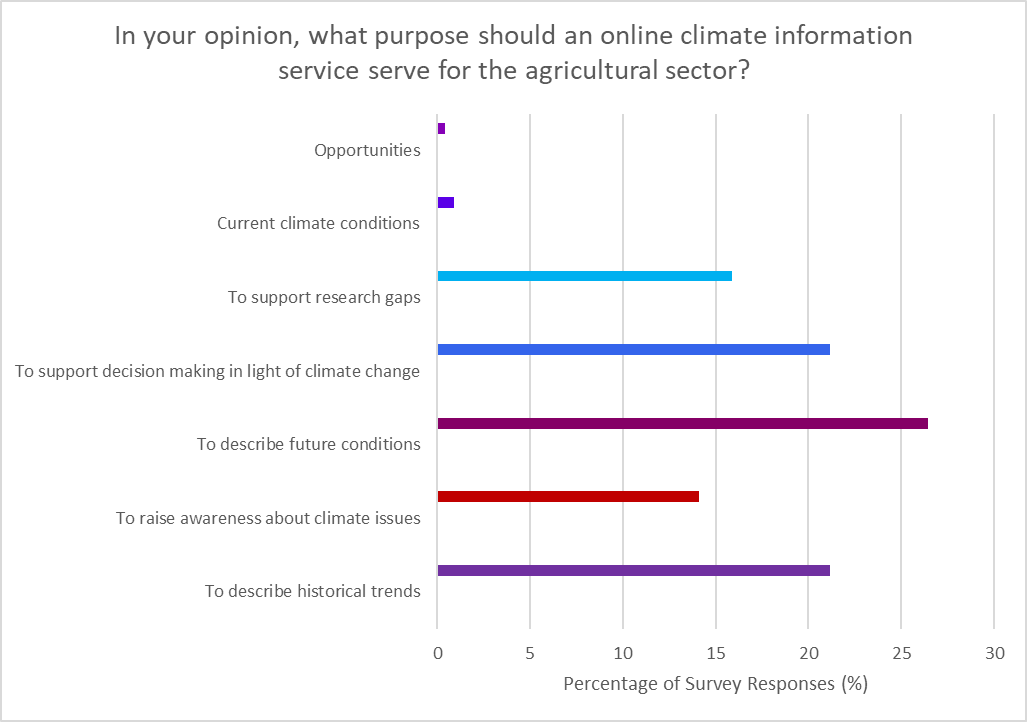
For the initial phase of engagement, a bilingual survey was developed by project partners to assess current climate data usage, motivations for accessing future climate data resources, climate indices, priority issues for adaptation, and data formats of interest. The survey was distributed through Agriculture and Agri-Food Canada’s mailing list in January 2020, receiving 206 respondents. The survey was not distributed in Quebec because Ouranos had recently partnered on a similar survey in the province, the results of which were shared with the project team.

The majority of respondents’ location of work was British Columbia, Ontario, and the Prairie provinces. Survey respondents were largely working as producers (45%), administrators (15%), and researchers (13%), though other roles in the sector were also represented. The initial survey provided insight into the climate information needs of producers and informed development of the initial module content. With a greater understanding of the subsets of the agricultural sector audience, subsequent engagement with the agricultural sector involved outreach events, presenting the agricultural content on ClimateData.ca to a broader audience, including researchers and government.

Key Findings

  • The top response relevant to a climate service provider was to obtain a description of future conditions (26% of respondents). This was closely followed by the goals of supporting decision-making and describing historical trends, both of which received 21% of responses.

Figure 1: Survey responses indicating expectations for the role of a climate information service (n=227).

  • While 78% of respondents utilized historic climate information in their role in the agricultural sector, that share dropped to 52% for climate projections.
  • The top ranked reason for considering future climate data was for on-farm planning (37%), followed by general awareness (22%), and risk management (19%). Research (10%) and policy and market impacts (7%) received fewer responses.
  • Over 80% of respondents indicated that climate variability had impacted their work, with the top issues being identified including extreme or unpredictable weather, supply chain predictability, changing seasonality, and drought/dry conditions.
  • Respondents identified a wide range of issues relating to climate change for the agricultural sector. The top issues included future crop suitability, pest distribution, and extreme weather which formed the topics for the initial agricultural case studies.
  • 69% of respondents reported a need for climate data available by political boundaries, far exceeding other options. As part of the module development, climate projection data was aggregated by census region.
  • Climate index selection was confirmed through the survey, with the indicators of greatest interest including cumulative growing season precipitation, drought indicators, frost-free season, date of last spring frost, and growing degree days (base 5°C). Many of those indices were calculated across Canada for ClimateData.ca and a growing degree day tool was added to the Analyze page to give users the option of specifying critical thresholds.

Figure 2: Climate indicators of interest to people working in the agricultural sector.

Survey responses (n=210) ranking the priority of adding different climate indices to ClimateData.ca, where 1 = less important and 5 = very high priority. The mean value across all respondents is shown on the figure.
  • Additional indices of interest included weekly/monthly precipitation, soil moisture, wind, snow cover, sunlight hours, and indices related to livestock production. Many of these are more complex to develop or robust projections are not currently available from the climate models.
  • As maps were the preferred data format (49%), ClimateData.ca has mapping functions for all pre-calculated indices (except those on the Analyze page).

Continued engagement

  • Attendees at a webinar hosted for the agricultural sector in fall 2021 indicated interest in further training materials, such as webinars, climate change impact and risk guidance, and easier access to data.
  • While ClimateData.ca cannot provide everything, understanding user needs enables the project team to link to relevant information where it exists elsewhere or consider for future development. Additional resources are featured on the landing page of the agricultural module, including seasonal forecasts, the Canadian Drought Monitor, AgWeather Quebec, and the Climate Atlas of Canada.

Next Steps

The next steps for agricultural engagement include more targeted outreach to subsets of the sector directly considering future climate change in their work and requiring access to climate projections. Engagement will aim to identify users’ needs and inform subsequent improvements to ClimateData.ca. Suggestions for additional content, data, or other improvements are always invited at the Feedback section of the website.