Major new release: Canadian Spatial Analogues Tool

Introduction

As climate change accelerates, the need for actionable data and tools to support climate adaptation is becoming ever more important. Whether you’re a local government official tasked with developing a comprehensive climate adaptation plan, a city planner working on urban resilience, an agricultural policy maker looking to future-proof farming techniques, or a healthcare administrator worried about future heatwaves, this tool can help you.

Spatial Analogues offer a window into your community’s climate future, helping you understand and anticipate the challenges and opportunities that lie ahead. With this tool, you’ll be better equipped to make informed policy decisions and foster resilient communities.

Ready to jump right in? Try out the new Spatial Analogues tool today.

The Adaptation Challenge

Take Québec City as an example. As the climate warms, the city will experience considerable climatic changes—from more frequent and intense heat to shifting precipitation patterns. Are there locations we can look to now that have temperature and precipitation regimes that are similar to Québec City’s projected future climate?

One possibility, according to the new Spatial Analogues tool, is Boston, Massachusetts. In 2041-2070, Québec City may have a climate that is similar to present-day Boston. By looking at how Boston deals with temperature and precipitation, planners in Québec City may find inspiration for their own future climate adaptation plans—everything from hospital preparation to community outreach.

The Spatial Analogues tool helps by providing actionable insights based on scientific data, thereby enabling effective climate adaptation planning.

How To Use the Spatial Analogues Tool: A Step-by-Step Guide

Step 1: Initiate A New Search

After opening the app, locate the bar titled “Begin a new search” on the left. This sets up your workspace for a new search query.

Step 2: Select Target Community

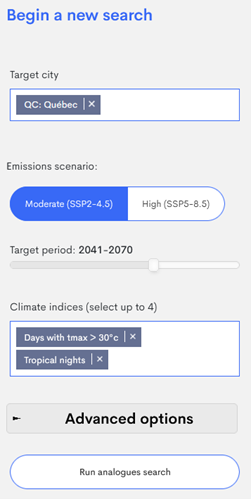
From the “Target city” dropdown menu, select the community you’re interested in. For this example, we will choose Québec City. A number of cities and towns are available for each province and territory.

Step 3: Choose Future Emissions Scenario

Select either a high emissions scenario (SSP5-8.5) or a moderate emissions scenario (SSP2-4.5). Your choice may impact the outcomes, in particular for later periods, as each scenario represents different levels of climate change severity. If unsure, consider looking at multiple scenarios for a more comprehensive analysis. It is highly recommended that you read our Learning Zone article on climate change scenarios, to better understand their use and limitations.

Step 4: Pick a Time Frame

Choose a future 30-year period to explore. Answering the question “which 30-year time period is most appropriate for my needs” can be complex. If you are dealing with assets that have an intended design life of 30 to 50 years, it may be practical to focus first on a mid-century period, such as 2041–2070. However, there may be value in looking further into the future to better understand the upper range of climate projections. Again, we highly recommend taking the time to read our using the analogues tool to make important decisions.

Step 5: Select Climate Indices

This is a crucial step that can impact your results. The way the analogues tool works is by selecting present-day locations that best match one or more (to a maximum of four) climate indices. Importantly, adding more variables is not always better, and as a general rule it is recommended to only select those variables which are related to the types of adaptation questions you want to explore. These indicators can include the average number of days per year that reach or exceed 30°C, the average length of the frost-free period, and/or the average total seasonal precipitation, just to name a few. You will need to choose indices that align with your specific needs, otherwise you risk producing an analogue that may be misleading. For example, if you run the tool using days greater than 30°C, then the analogues that you get will be useful for hot temperature related studies but likely not well suited for understanding how winter conditions are likely to change in the future.

Here are some examples from which you can draw inspiration:

  1. Studying Heatwaves and Summer Temperatures: If your concern is adapting to warmer summers, look at variables like ‘Tropical nights’ (nights where the temperature doesn’t dip below 22°C) and ‘Days with Tmax > 30°C’ (representing extreme summer heat).
  2. Focusing on Precipitation Changes: When your interest lies in understanding how rainfall or snowfall patterns will change, you might select indices like ‘Wet days’ (days receiving at least 20 mm of precipitation), ‘Maximum 5-day precipitation,’ and ‘Total Precipitation’ (the yearly average of both rain and snow).
  3. Exploring the Disappearance of Cold: If it’s the dwindling cold conditions you’re studying, opt for indices like ‘Frost days’ (days when the temperature drops to or below 0°C) and ‘Ice Days’ (days where even the daily high temperature doesn’t climb above freezing).
  4. Understanding Agricultural Adaptation: If farming conditions are your primary concern, consider variables such as ‘Growing season length,’ ‘Last Spring Frost’ (the latest typical date for a frost event in the spring), and ‘First Fall Frost’ (the earliest typical date for frost as autumn approaches).

If you’re unsure about which variables to include, don’t hesitate to contact the Climate Services Support Desk for expert advice. It’s also important to consult with local stakeholders and experts to ensure the variables you choose are relevant to your city’s unique needs.

Step 6: Run the Search

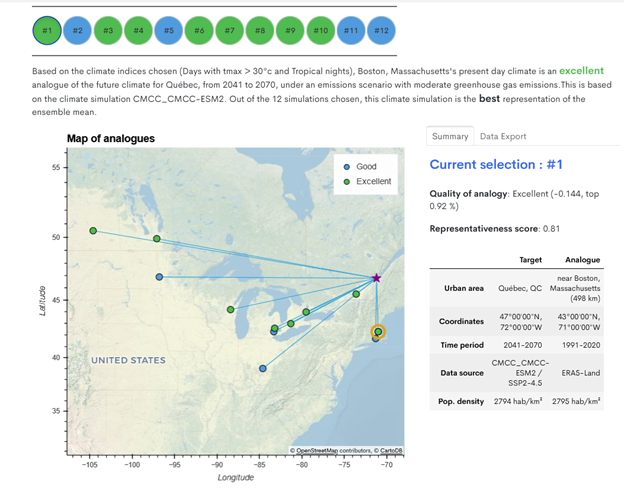
Press the “Run analogues search” button. Your results will display in a map, showing climate analogues as colored dots linked to your target city. The tool provides users with feedback on how good (or poor) of a fit the various analogues are. Please consider reading the technical guidance document on the tool for more information.

Interpreting Results

Your results will offer a wealth of data, including Analogue Quality and Representativeness scores. For users who wish to better understand the metrics that describe these data, please read the technical document linked above. It is important to always consider these results as part of a broader research and planning process, and to carefully evaluate how tuning the program’s inputs (time period, emissions scenario, and variables) impacts the final result.

In this example, we ran the analogues tool for Québec City, selecting SSP2-4.5 as the emission scenario, 2041-2070 as the future time period and Days with tmax > 30°C and Tropical Nights as the indicators.

The program found many ‘excellent’ (i.e., top 1 percentile) matches, including Boston, Massachusetts. The quality of this analogy is -0.144, which the program indicates is in the top 0.92%. But what does this actually mean? Well, the score is a measure of “dissimilarity”, and so the smaller the score the better the match. Given all possible fits, this score is very low, with more than 99.18% of all other locations coming in with higher dissimilarity scores.

Moreover, the program tells us that the representative score for this analogue is 0.81 (again, lower is better). Analogues are produced from individual models, and so what this score represents is the extent to which the model used to generate the analogue is similar to the projections of other models in the ensemble. A higher representative score means that the result from individual model is closer to the average of all models, and therefore more “representative.” For example, Convington Kentucky has a score of 9.74, and is considered a “good” analogue. Consider it this way: a location may have a very good “quality” score but may be using a model that is not representative of other models. So, like the “quality of analogy” score, a lower representativeness score is better.

In this analysis, a total of 12 spatial analogues were presented (if you peek in the Advanced Options you’ll see you can change this number), and many of these were also found to be an ‘excellent’ fit with Québec City. These are displayed on the map as additional green dots. Clicking on these points will reveal how well these locations scored.

Final Thoughts: Exercise Caution and Experiment

Using the Spatial Analogues tool requires you to make several choices that could significantly impact your results. It’s crucial to exercise caution and rigor in your selections, keeping in mind the uncertainties associated with using future climate model data. Always consult with various stakeholders to ensure that the results are both meaningful and not misleading. If you have any doubt about any step, the Climate Services Support Desk is just an email or phone call away.

In the example we outlined above, one could make the case that Boston may be a good place to start when looking at how other cities deal with extreme heat. However, the tool indicated that many other cities across Canada and the United States are also excellent analogues for Québec City’s future summer temperatures. Re-running the analogue tool and changing the emissions scenario, time period, and variables of interest may reveal additional insights.

By integrating Spatial Analogues into your climate planning efforts thoughtfully, you’re not merely preparing for an uncertain future, you’re arming yourself with data-driven insights about the future climate.

What’s coming next?

In addition to the data and results, what makes the Canadian Spatial Analogue application so exciting is that it’s the first release of a new kind of tool that we’ve been working on. These new tools are built using Python rather than HTML and JavaScript. As a result, these tools are more accessible to a wide range of computer programmers and scientists. We envision developing several new Apps in the future that will allow for unprecedented levels of analysis and customization. Please stay tuned for more exciting releases!


Subscribe to Climate Data’s Newsletter