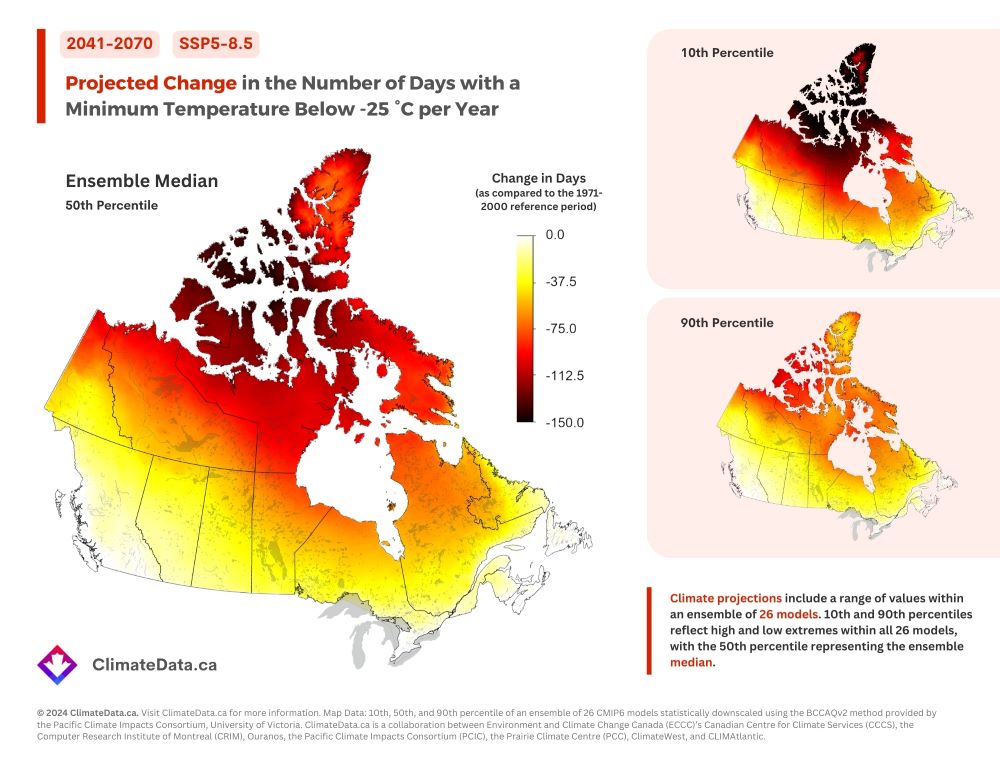
Map Insights
These maps illustrate the very large changes in cold days across Canada that are likely under the SSP5-8.5 scenario. The most pronounced loss of cold is expected in northern regions, which currently experience a higher frequency of such days. In some areas, the decrease may reach up to 150 days per year compared to the recent past, as indicated by the 10th percentile inset map.[1] Both the ensemble median and the 90th percentile maps show a widespread decrease in cold days throughout the country, albeit to varying extents.
These data underscore the need to assess the impacts and risks associated with ongoing climate change, in this case, emphasizing the changes projected under the highest emissions scenario, end-of-century, and upper percentile of the multi-model ensemble. This shift suggests major impacts on natural ecosystems and human activities that depend on extreme cold. The diminishing cold will notably influence infrastructure planning and economic activities that are sensitive to extreme cold conditions.