Map of the Month: Winter Precipitation
In this series, we take a deep dive into the many climate change maps available on ClimateData.ca. This month, we are focusing on maps showing projected changes in winter precipitation.
Why Winter Precipitation Matters
Precipitation is any form of water that falls from clouds and reaches the ground. It can fall in the form of a liquid (rain) or solid (snow, sleet, freezing rain). It is crucial to society as well as in shaping and sustaining ecosystems, ensuring that there is adequate water available for human and animal needs, agriculture, electricity generation, and wildfire suppression.
Deciphering the Map’s Message
We refer to the maps below as delta maps, which illustrate changes in winter precipitation between a historical baseline period (1971-2000) and a projected future period (2051-2080) under the SSP3-7.0 climate change scenario. This scenario was chosen for two reasons. First because it reflects a medium-to-high emissions pathway, providing insights into a plausible range of future climate impacts, and second because it is new to ClimateData.ca, joining SSP1-2.6, SSP2-4.5, and SSP5-8.5. To learn more about climate change scenarios, visit our Learning Zone article on the subject.
The maps presented here show two types of delta maps: absolute delta and percent delta maps.
- Absolute Delta Map (left): This map displays the difference in total winter precipitation totals between a historical (1971-2000) and a future (2051-2080) time period. It is useful for visualizing the magnitude of change in precipitation amounts across the country, regardless of regional climate variations.
- Percent Delta Map (right): This map represents the percentage change in winter precipitation between a historical (1971-2000) and a future (2051-2080) time period. Percent delta maps are often more informative for interpreting the relative magnitude of regional precipitation changes. This is especially the case in regions with low total seasonal precipitation, as even a relatively small increase in precipitation can result in a large percentage change. Conversely, in regions with already high precipitation, even a large absolute change in precipitation may result in a relatively small percentage change.
Both map types offer valuable insights, with the percent delta map often being more effective for understanding relative changes in drier regions, while the absolute delta map helps compare the magnitude of precipitation shifts across the country.
Map Insights
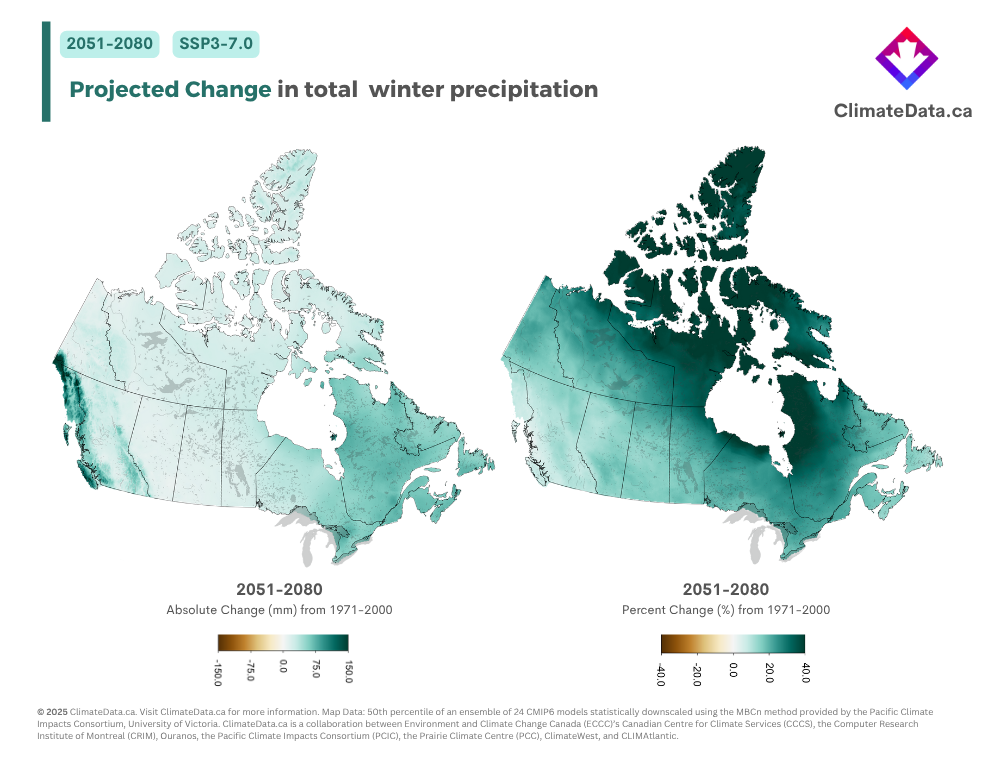
These maps reveal that winter precipitation will increase as the planet warms under the SSP3-7.0 emissions scenario. On both maps, the green shades indicate regions where precipitation is expected to increase. White indicates no change, while brown indicates a decrease in winter precipitation.
The two delta maps tell very different stories about projected changes in winter precipitation. The absolute delta map (left) indicates that the greatest absolute change in projected winter precipitation will occur along coastal and southwestern British Columbia, with secondary maxima seen over the Rocky Mountains, Ontario, Quebec, and Atlantic Canada.
Conversely, on the percent delta map (right), the greatest relative winter precipitation changes occur in northern Canada, specifically across Nunavut and regions bordering Hudson Bay. Parts of coastal British Columbia, meanwhile, appear on this map as very light green or even white, signifying very little to no change in relative winter precipitation.
Important Map Caveats
On ClimateData.ca, SSP3-7.0 is a medium-to-high emissions pathway scenario. To learn more about emission scenarios, please visit our learning zone article on the topic.
Browse More Maps and Data
To browse more maps on ClimateData.ca, including projected winter precipitation changes under different time periods and scenarios than what is shown here, please visit our interactive map page.