What the developing exceptional El Niño means for Canada in 2026-27

Date August 21, 2026
Author Hayley Dosser, Canadian Centre for Climate Services. Contributors: Jacinthe Racine and Rachel Malena-Chan (CCCS); Bill Merryfield, Julia Velletta and Woosung Lee (Sub-seasonal to Decadal Prediction)
Topics New and Noteworthy, Seasonal to decadal forecasts
Share this post

Winter 2026-27 is expected to be milder overall across much of Canada due to El Niño, with an elevated risk of extreme weather events worldwide, including in Canada.

This increased risk may extend into spring and possibly summer of 2027, with the potential for severe drought and wildfire. As a result, this El Niño event could have major impacts on communities, infrastructure, and Canada’s economy.

The big picture: A very strong El Niño is forming, with major global impacts expected

El Niño conditions have officially formed in the tropical Pacific and are forecasted to strengthen, increasing the likelihood of extreme weather events in many regions across the globe [1]. Predictions from global seasonal forecasting centres, including Environment and Climate Change Canada (ECCC), are in high agreement that this El Niño is virtually certain (>99% probability) to be a “very strong” event (Box 1), peaking in intensity in late fall or early winter. Even forecasts based on the Relative Oceanic Niño Index (Box 2), which adjusts for the overall tropical ocean warming caused by climate change, are predicting a 95% probability of a very strong El Niño event this year. Stronger El Niño events tilt the odds toward large temperature and precipitation anomalies, which in turn increase the likelihood of major impacts across multiple sectors ([2], [3]).

Jump back to top

Box 1: How is an El Niño event declared?

For an El Niño event to be declared, three criteria must be met:

    1. The average sea surface temperature (SST) must rise by more than 0.5°C in a specific region of the Pacific Ocean known as the Niño-3.4 region.
    2. This SST anomaly must last for at least five consecutive overlapping three-month periods.
    3. The atmosphere must respond to the increase in SST with a sustained weakening or reversal of equatorial trade winds.

If the criteria are met and SST rises by more than 2.0°C, the event is considered “very strong”.

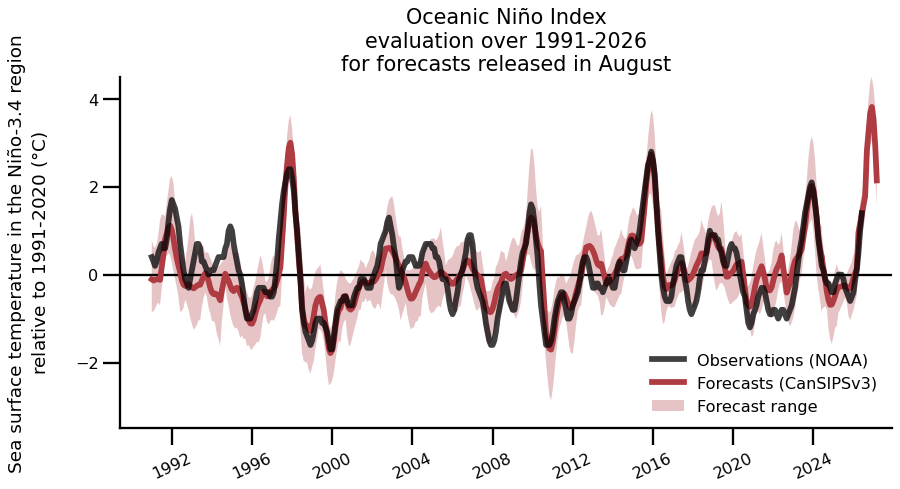
In fact, it is now a realistic possibility that this year’s El Niño event will be stronger than any in the historical record. The ECCC CanSIPSv3 system, which has historically performed well when predicting very strong El Niño events, is predicting that average sea surface temperature (SST) in the Niño-3.4 region will very likely (>90% probability) exceed 3.0°C above the historical baseline, possibly by a significant margin, by late 2026 [Figure 1]. Such an extreme El Niño event would be unprecedented in the observational record [3].

“Both observations and forecasts are pointing toward an extraordinary El Niño event… forecasts give a near certainty of the Niño-3.4 index exceeding 2°C (’very strong’), with some ensemble members including from ECCC approaching or exceeding 4°C, which would be unprecedented in the modern record by a substantial margin.” – ECCC scientist Dr. Bill Merryfield

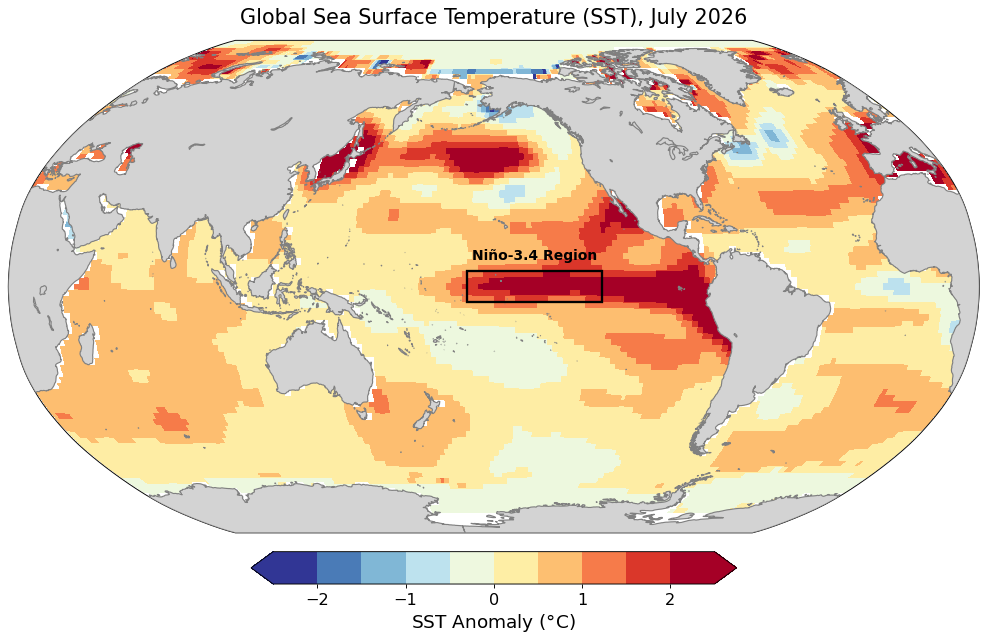
Figure 1 a: Global map showing the observed SST anomaly for July 2026 relative to the 1991 to 2020 period, using the NOAA Extended Reconstructed Sea Surface Temperature (ERSSTv5) product. The Niño-3.4 region is indicated by the box. 

Figure 1 b: Evaluation of past forecasts of the Oceanic Niño Index (ONI), produced by CanSIPSv3 for 1991 to 2020. The central estimates of the forecasts, initialized in August of each year and covering the following 12 months, are shown in red and the observed values of the ONI are shown in black, using National Oceanic and Atmospheric Administration (NOAA) estimates. Both the observed and forecasted ONI values are for three-month rolling seasons, calculated from SST in the Niño-3.4 region relative to the 1991 to 2020 period. The observations end in July 2026 and the forecasts extend to April 2027. 

Box 2: Measuring ENSO – Niño-3.4 index vs. ONI vs. RONI

SST changes in the Niño-3.4 region are measured using the Niño-3.4 index. The Oceanic Niño Index (ONI) is a three-month rolling average of the Niño-3.4 index and has long been the dominant index used to declare an El Niño event. The ONI measures SSTs relative to either a fixed or sliding historical baseline. A sliding historical baseline is used to account for ocean warming caused by climate change. However, even when using a sliding baseline, SSTs in recent years are compared to the 1991 to 2020 baseline period and so are biased high by the ocean warming that has occurred since. The Relative Oceanic Niño Index (RONI) is increasingly being adopted as the preferred index to measure El Niño-Southern Oscillation (ENSO) events. It measures SST in the Niño-3.4 region relative to SSTs over the entire tropical ocean, and so can better separate shifts due to ENSO from changes due to global warming. ([4], [5]).

ENSO and climate change: 2027 is highly likely to become the hottest year on record

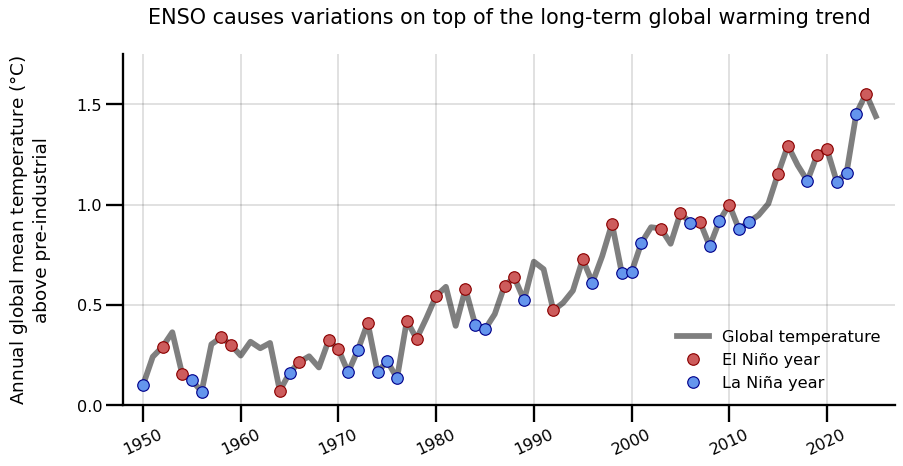
El Niño is a natural phenomenon. It is the positive phase of the El Niño Southern Oscillation (ENSO), with the warm (El Niño) and cool (La Niña) phases happening every two to seven years on average. ENSO adds natural ups and downs to the long-term rise in global temperatures caused by human-induced climate change [Figure 2]. Generally, global temperatures rise above the warming trend during El Niño events and drop below it during La Niña events. While there is some limited evidence that climate change may increase the strength and duration of ENSO events ([6], [7], [8]), Canada’s Changing Climate Report 2026 states that there is currently low confidence in these projected future changes. However, the report is clear that continued climate warming may increase the frequency and intensity of ENSO-driven extreme weather events in Canada.

Figure 2: The observed annual global mean temperatures for each year from 1950 to 2025 are shown relative to the pre-industrial global mean temperature (1850-1900, before most human-caused warming occurred) using estimates from the WMO. El Niño years are indicated by red dots and La Niña years are indicated by blue dots, based on winter (December to February for the year corresponding to January) values of NOAA’s ONI with sliding baseline periods.

A very strong El Niño in 2026-27 makes it highly likely that 2027 will become the hottest year on record, with the average global mean temperature for the year breaking the previous record set in 2024. Record global temperatures have occurred in the year following the peak of many previous El Niño events [Figure 2]. For each 1°C increase in the Niño‐3.4 index, the global average temperature increases temporarily by approximately 0.06 to 0.1°C, peaking three months after the Niño‐3.4 index ([9], [10]). The El Niño events themselves tend to last between 9 and 18 months ([4], [11]), followed by shifts to ENSO-neutral or La Niña conditions with a corresponding decrease in global temperatures.

Jump back to top

ENSO and extreme weather: 2026-27 has the potential to be a year of high-impact weather events

ENSO contributes to variability in the climate system, with El Niño leading to an increase in extreme weather events across many parts of the globe, including more frequent and severe heat waves, wildfires, droughts, and flooding [11]. Previous very strong El Niño events occurred in 1982-83, 1997-98, and 2015-16, resulting in global impacts on agricultural yields and public health, including food insecurity, disease outbreaks and air pollution [12]. During some of these very strong El Niño events, Indonesia and Australia faced severe drought and extensive wildfires, while Peru and California experienced heavy rainfall that led to significant flooding and landslides. Southern Africa, India, Central America, and southeast Asia dealt with widespread crop losses, financial stress, and food shortages, and there were major outbreaks of Zika in South America and dengue fever in the tropics. These events also affected fisheries, energy, water resources, transportation, and tourism [13]. Economic losses due to these events can persist for over five years, with global losses from the 1982-83 and 1997-98 events estimated at trillions of dollars each [2].

Jump back to top

El Niño and Canada: What past events and seasonal forecasts can tell us

El Niño events typically peak in late fall and early winter, with the strongest direct effects on weather in Canada occurring from early winter through the following spring. The influence of El Niño alters the typical patterns of temperature and precipitation across Canada ([14], [15]) and is linked to temperature and precipitation extremes ([16], [17]). In general, El Niño tends to cause milder winters with less snow and warmer, drier springs in western, northwestern and central Canada [18]. Co-occurring dry and warm extremes become more frequent in the west and northwest [19]. Due to the downstream effect of these shifts and the increased risk of extreme weather events, very strong El Niño events have had major impacts on Canada, with drought leading to crop losses, elevated ocean temperatures and marine heatwaves affecting fisheries, and infrastructure damage resulting from wildfires, coastal storms, and freezing rain. These very strong El Niño events are estimated to have cost the Canadian economy billions of dollars [14].

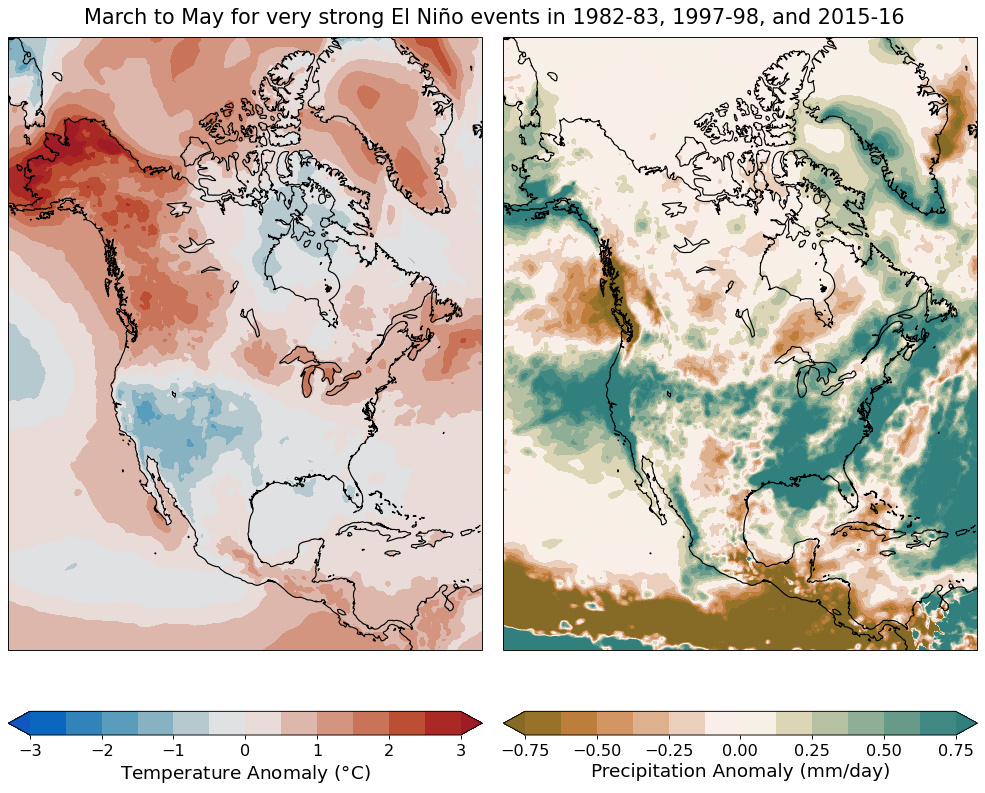
Every El Niño event is different and the effects on a specific region can be hard to predict due to other sources of climate variability, such as the Pacific Decadal Oscillation (PDO) [20]. However, we can use past El Niño events as a guide [Figure 3], combined with the seasonal forecasts for the coming year [Figure 4]. Seasonal forecasts for Canada tend to be more skillful during ENSO events [14].

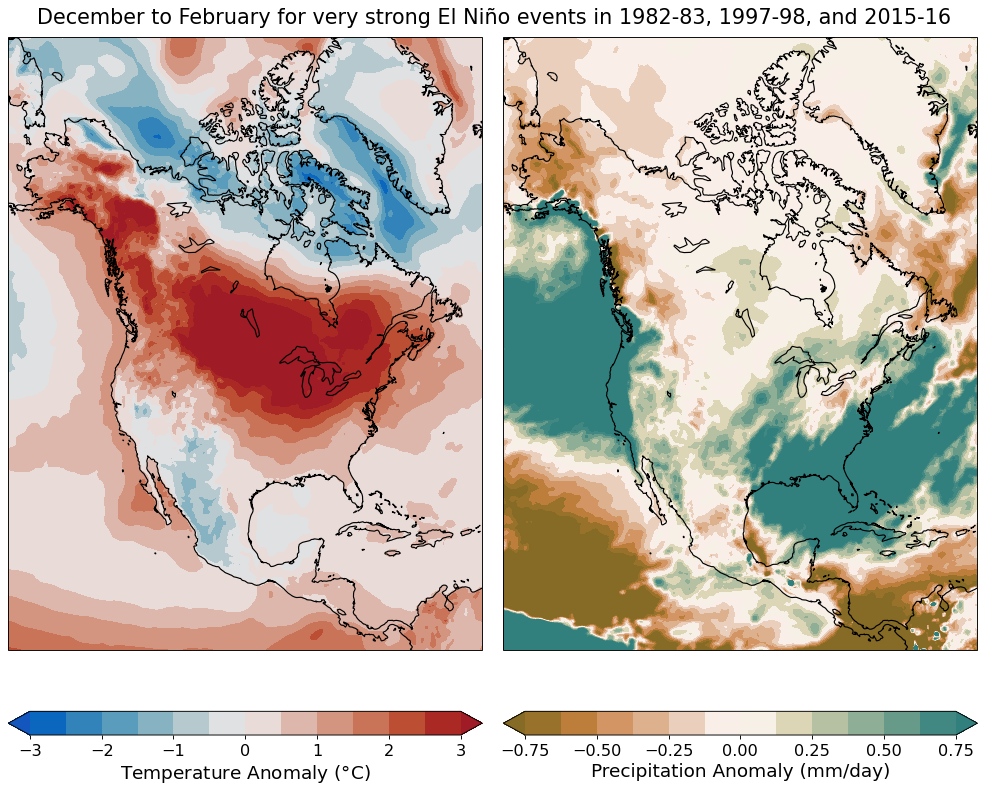
Figure 3: Average temperature and precipitation anomalies for December to February (top) and March to May (bottom) for the three very strong El Niño events that occurred between 1956 and 2025, based on ERA5 reanalysis monthly-averaged data. The difference is calculated between the seasonal average during the very strong events and the corresponding climatological average for that season defined using a sliding 30-year baseline period. For example, the 1956 to 1960 anomaly uses the 1941 to 1970 baseline period, the 1961 to 1965 anomaly uses the 1946 to 1975 baseline period and so on. The 1991-2020 baseline period is used from 2006 until present. NOAA’s ONI with sliding baseline periods is used to define the very strong El Niño events.

Over Canada, the last three very strong El Niño events produced similar patterns of winter warming and drying to other El Niño events, though the magnitude of the temperature and precipitation signals was larger, indicating these events generally had a stronger effect on seasonal conditions.

There are a few key differences between the observed influences of the very strong El Niño events and other El Niño events, although with only three very strong events it is unclear how meaningful the differences are. During very strong El Niño events, the winter warming signal tended to be shifted eastwards, with the strongest warming occurring east of the Rocky Mountains [21] and extending through Ontario and Quebec to Atlantic Canada. North of the polar jet stream, most of Nunavut tended to experience colder-than-normal winters. While the very strong El Niño events produced the expected dry winters over much of British Columbia (BC) and the Yukon, they also coincided with wetter winters in some coastal regions, with parts of coastal BC and Atlantic Canada experiencing increased precipitation [15]. Near the Great Lakes, dry conditions occurred in some areas as expected, however many other areas experienced increased precipitation.

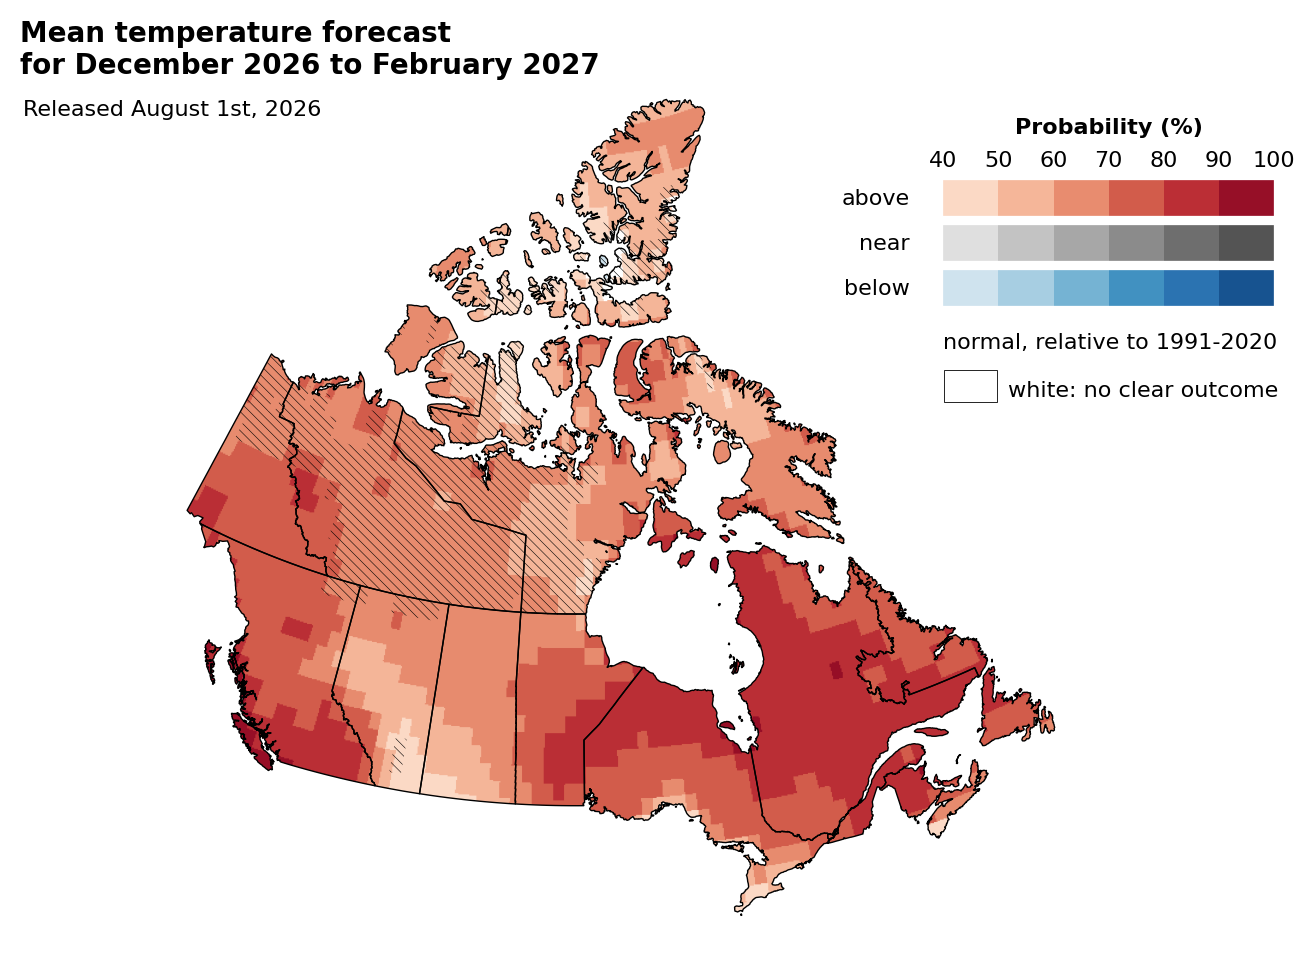
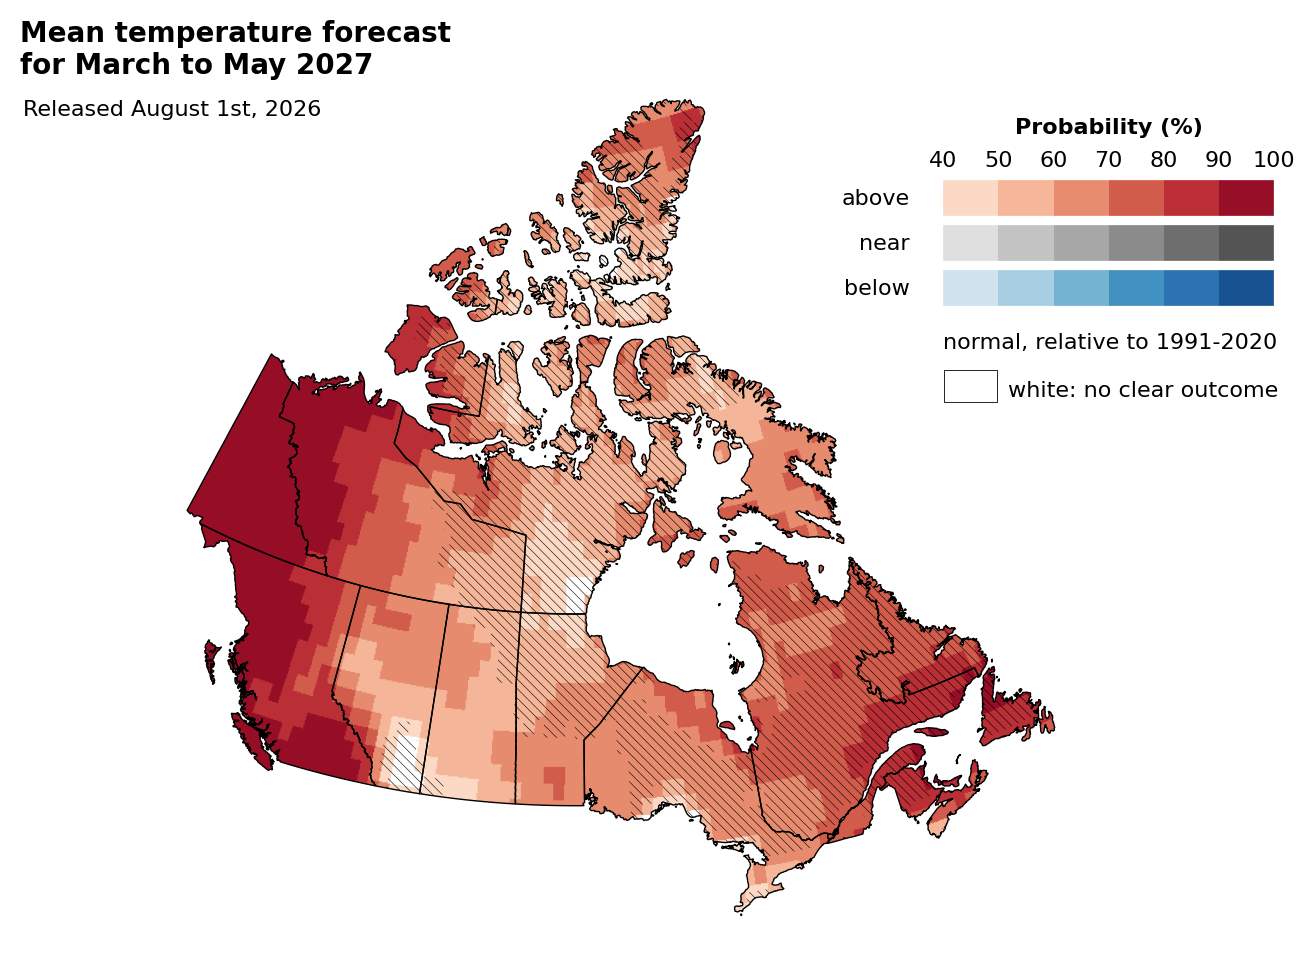
Figure 4: Mean temperature seasonal forecasts for December 2026 to February (top) 2027 and March to May 2027 (bottom), released August 1st, 2026. Forecasts show the probability that the mean temperature will be above, near, or below normal, relative to a 1991 to 2020 historical climatology. Hatching shows locations where the forecast system has low or no skill for this season and month of release. Forecasts are created using the ECCC CanSIPSv3 seasonal prediction system.

The forecast for December 2026 to February 2027, released August 1st on ClimateData.ca, shows that above normal mean temperatures are likely over much of BC, the Yukon, Manitoba, Ontario, Quebec, and Atlantic Canada, consistent with past events. The precipitation forecast indicates that drier than normal conditions are the most likely outcome over the Rocky Mountains, BC Okanagan region, much of Alberta, and parts of the Yukon and Saskatchewan. During past very strong El Niño events, notably warm and dry conditions persisted through the spring in BC and the Yukon [15], including along the coast. The mean temperature forecast for March to May 2027 predicts at least a 90% probability of above normal temperatures over most of western Canada. In fact, it is likely to very likely that unusually high temperatures (around 1 to 2°C warmer than the 1991-2020 average) will occur over large areas of BC and the Yukon in spring 2027. As the winter and spring seasons approach, updated forecasts are expected to provide a clearer picture of the expected seasonal conditions.

Jump back to top

El Niño and Canada: Regional impacts

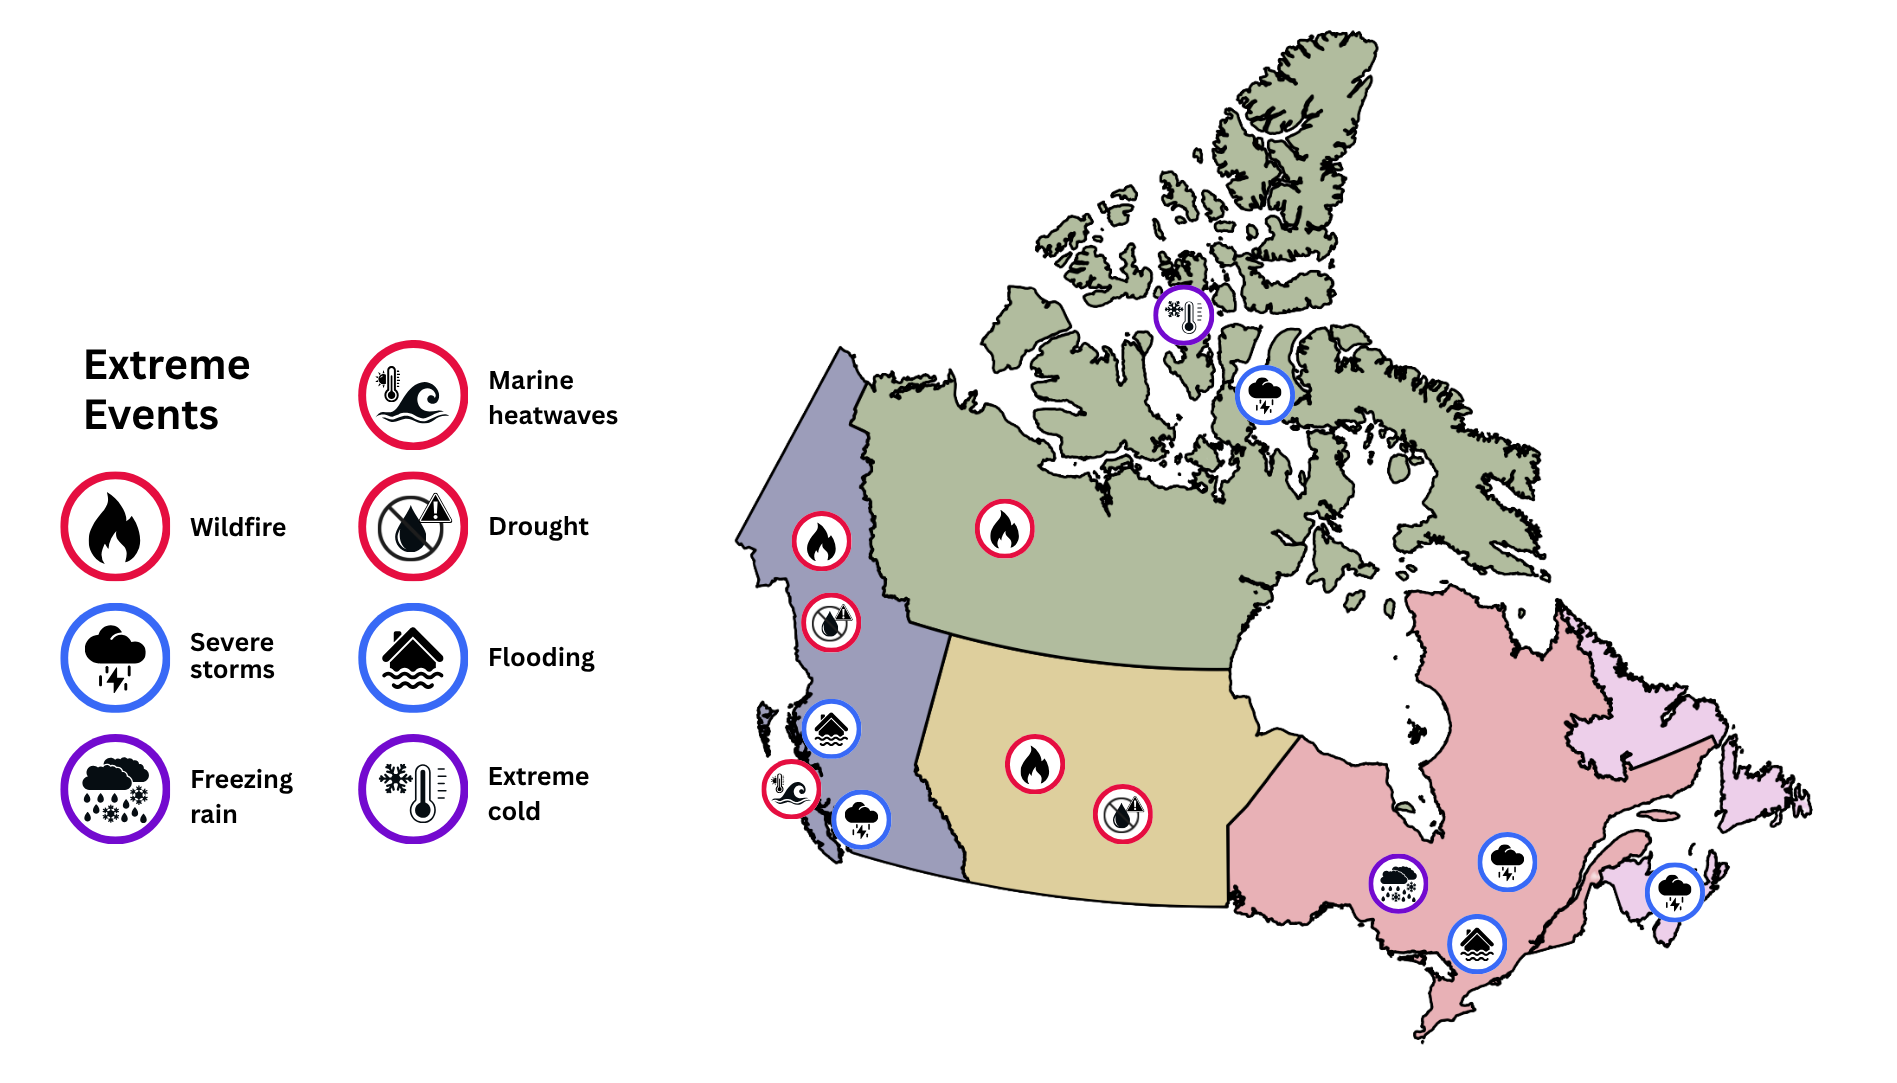
Regions across Canada tend to experience an increase in extreme weather during El Niño events [Figure 5], though the magnitude and location of impacts vary from event to event.

Figure 5: In addition to a milder winter with less snow, very strong El Niño events tend to cause an increase in extreme weather events in regions across Canada. The diagram shows the types of extreme weather that past El Niño events have been linked to in each region.

BC and the Yukon

Reduced precipitation over western Canada, partly due to less precipitation from atmospheric rivers during the winter, can lead to a lower than normal snowpack [18], drought [15], and a greater burned area the following spring and summer resulting in part from large lightning-initiated wildfires ([22], [23], [24]). Increased lightning strikes west of the Rocky Mountains have been observed during El Niño events as a result of increased convective instability driven by warmer than normal sea surface temperatures (SSTs) in the Pacific ([25], [26]).

BC is also at risk of landslides and flooding during very strong El Niño events due to some coastal locations receiving more rather than less winter precipitation [27] and precipitation falling as heavy rain rather than snow [15]. Coastal erosion and flooding can result from higher sea levels, stronger wave activity, and storm surges. In 1997-98, record-breaking rainfall caused severe damage to the Trans-Canada Highway and led to rail and road closures and disruptions [15]. Reduced snowpack in the mountains also affects winter recreation and tourism, as well as hydroelectric generation and municipal water management the following summer [14].

Along the BC coast, warmer SSTs can affect fisheries and aquaculture. Marine heatwaves affecting shellfish have been linked to previous El Niño events [28]. Mackerel – not typically found in BC waters – have been observed migrating further north and preying on juvenile salmon, leading to negative impacts on the Canadian fishing [14].

Prairies

Reduced snowfall over the Rocky Mountains during El Niño events, coupled with less precipitation in winter and spring across parts of the Prairies, can cause reductions in spring surface runoff and soil moisture [29]. This ultimately leads to increased risk of spring wildfires and severe to extreme drought, particularly in grain-growing regions with pre-existing drought conditions ([14], [30], [15]). The Fort McMurray wildfire, the costliest natural disaster in Canadian history, occurred during the late stages of the very strong El Niño in 2015-16.

Although a mild winter can result in a longer growing season, prior very strong El Niño events had a negative impact on agriculture in the Prairies, leading to reduced productivity and crop losses due to dry weather or prolonged drought [14].

Central Canada

Since winter temperatures tend to be warmer during very strong El Niño events, more winter precipitation falls as rain. Snow cover decreases over Ontario and Quebec, though the affected areas vary from event to event. This reduces opportunities for winter recreation and can lead to localized flooding and freezing-rain events, with impacts on transportation, the energy sector, and municipal planning ([14], [18], [15]). One of the worst extreme weather events to ever occur in Canada, a catastrophic freezing-rain event in Ontario and Quebec knows as the Great Ice Storm of 1998, was partially caused by the very strong El Niño in 1997-98 [31].

Water resources, ecosystems and agriculture are also impacted by ENSO [18]. The ice wine industry [14] and maple syrup production [32] are both negatively affected by mild winters and temperature extremes, which are made more likely by El Niño events. In general, Central Canada can expect a mild winter and spring potentially punctuated by extreme weather events.

Atlantic Canada

In addition to a milder winter with less snow, Atlantic Canada can expect a reduction in the number and intensity of Atlantic hurricanes during the preceding summer and fall due to El Niño [33]. Along with less disruption to maritime operations and shipping [15] this is expected to lower risks of direct impacts on the eastern provinces, although vigilance should be maintained. However, changes in the jet stream can bring an increase in winter storms [34], accompanied by coastal flooding and storm surges, affecting transportation and infrastructure [15]. Warm winter temperatures can also reduce seasonal sea ice in the region. In the record-warm winter of 2023-24, during a strong El Niño event, the Gulf of St. Lawrence recorded the lowest seasonal sea ice cover since 1969 [35].

Northwest Territories and Nunavut

The Northwest Territories tend to experience warmer and drier winters during strong El Niño events, with less snowfall and increased risk of wildfires and poor air quality the following spring and summer. Warmer SSTs can also cause a delayed freeze-up in Hudson Bay. On the other hand, Nunavut tends to experience colder winters during very strong El Niño events [36], with extreme cold periods, severe storms, and the potential for large swings in temperature. This can affect travel and the stability of ice roads ([37], [38]).

Summary

As this potentially unprecedented 2026-27 El Niño event develops, many Canadians are likely to experience a milder winter overall, with an increased risk of some types of extreme weather events. During a very strong El Niño, much of Canada tends to be significantly warmer than normal during winter, while western Canada is typically warmer and drier overall in both winter and spring. These conditions can increase regional risks of coastal storms and freezing rain, as well as drought and wildfire into spring and summer. See Box 3 for resources on how to prepare. To stay informed about the conditions expected in your region, check back for updated monthly and seasonal forecasts on ClimateData.ca.

Jump back to top

References

[1] World Meteorological Organization. (July 3, 2026). El Niño is forecast to intensify, increasing likelihood of extreme weather [Press release]. https://wmo.int/news/media-centre/el-nino-forecast-intensify-increasing-likelihood-of-extreme-weather

[2] Callahan, C. W. and Mankin, J. S. (2023). Persistent effect of El Niño on global economic growth. Science 380, 1064-1069. https://doi.org/10.1126/science.adf2983

[3] Merryfield, W. J. and Lee, WS. (2023). Estimating Probabilities of Extreme ENSO Events from Copernicus Seasonal Hindcasts. Asia-Pac. J. Atmos. Sci. 59, 479–493. https://doi.org/10.1007/s13143-023-00328-2

[4] World Meteorological Organization. (Accessed July 30, 2026). El Niño / La Niña Phenomena. https://wmo.int/themes/el-nino-la-nina-phenomena

[5] National Oceanic and Atmospheric Administration. Equatorial Pacific Sea Surface Temperatures (SST). (Accessed July 30, 2026). National Centers for Environmental Information. https://www.ncei.noaa.gov/access/monitoring/enso/sst

[6] McPhaden, M. (July 27, 2023). Has climate change already affected ENSO? National Oceanic and Atmospheric Administration (NOAA) Climate.gov. https://www.climate.gov/news-features/blogs/enso/has-climate-change-already-affected-enso

[7] Cai, W., Ng, B., Geng, T. et al. (2023). Anthropogenic impacts on twentieth-century ENSO variability changes. Nat. Rev. Earth Environ. 4, 407–418. https://doi.org/10.1038/s43017-023-00427-8

[8] Adibi, P., Rezaian, R., Alizadeh, O. et al. (2026). Intensity-dependent changes in ENSO frequency and lifecycle characteristics under future climate change. Clim. Dyn. 64, 341. https://doi.org/10.1007/s00382-026-08288-9

[9] Trenberth, K. E., Caron, J. M., Stepaniak, D. P. and Worley, S. (2002). Evolution of El Niño–Southern Oscillation and global atmospheric surface temperatures, J. Geophys. Res., 107(D8). https://doi.org/10.1029/2000JD000298

[10] Tippett, M. K. and Becker, E. J. (2026). ENSO-conditioned evolution of global mean surface temperature. Geophys. Res. Lett., 53, e2026GL124175. https://doi.org/10.1029/2026GL124175

[11] World Meteorological Organization. (June 2, 2026). WMO: Prepare for El Niño [Press release]. https://wmo.int/news/media-centre/wmo-prepare-el-nino

[12] World Health Organization. (2023). Public Health Situation Analysis: El Niño. https://www.who.int/publications/m/item/public-health-situation-analysis–el-ni-o

[13] McPhaden, M. J. et al. (2006). ENSO as an Integrating Concept in Earth Science. Science 314, 1740-1745. https://doi.org/10.1126/science.1132588

[14] Shabbar, A. (2006). The impact of El Niño-Southern Oscillation on the Canadian climate. Adv. Geosci., 6, 149–153. https://doi.org/10.5194/adgeo-6-149-2006

[15] Islam, M., Kabir, G., and Anis, M. R. (2025). Evaluating ENSO-driven risks to strengthen transportation system resilience of Canadian provinces. Can. J. Civ. Eng. 52(9): 1630-1644. https://doi.org/10.1139/cjce-2025-0118

[16] Shabbar, A. and Bonsal, B. (2004). Associations between low frequency variability modes and winter temperature extremes in Canada. Atmos.-Ocean, 42(2), 127–140. https://doi.org/10.3137/ao.420204

[17] Tan, X. and Gan, T. Y. (2017). Non-stationary analysis of the frequency and intensity of heavy precipitation over Canada and their relations to large-scale climate patterns. Clim. Dyn. 48, 2983–3001. https://doi.org/10.1007/s00382-016-3246-9

[18] Amiri, A., Gumiere, S., Bonakdari, H. (2024). White blanket, blue waters: Tracing El Niño footprints in Canada. Int. J. Appl. Earth Obs. Geoinf. 135. https://doi.org/10.1016/j.jag.2024.104267

[19] Yang, R., Zhang, S. Tang, X. et al. (2026). Spatiotemporal Changes and Climate Driving Factors of Compound Precipitation-Temperature Extreme Events Across Global Land Areas. Int. J. Climatol. e70491. https://doi.org/10.1002/joc.70491

20] Maher, N., Kay, J. E. and Capotondi, A. (2022). Modulation of ENSO teleconnections over North America by the Pacific decadal oscillation. Environ. Res. Lett. 17, 114005. https://doi.org/10.1088/1748-9326/ac9327

[21] Beniche, M., Vialard, J., Lengaigne, M. et al. (2024). A distinct and reproducible teleconnection pattern over North America during extreme El Niño events. Sci. Rep. 14, 2457 https://doi.org/10.1038/s41598-024-52580-9

[22] Wang, Y., Flannigan, M. and Anderson, K. (2010). Correlations between forest fires in British Columbia, Canada, and sea surface temperature of the Pacific Ocean. Ecol. Model. 221(1). https://doi.org/10.1016/j.ecolmodel.2008.12.007

[23] Cardil, A., Rodrigues, M., Tapia, M. et al. (2023). Climate teleconnections modulate global burned area. Nat. Commun. 14, 427. https://doi.org/10.1038/s41467-023-36052-8

[24] Justino, F., Bromwich, D.H. and Gurjão, C. (2026). Atmospheric rivers as mediators between climate teleconnections and burned area variability in North America. Commun. Earth Environ. 7, 99. https://doi.org/10.1038/s43247-025-03124-0

[25] Macias Fauria, M. and Johnson, E. A. (2006). Large-scale climatic patterns control large lightning fire occurrence in Canada and Alaska forest regions, J. Geophys. Res., 111, G04008. https://doi.org/10.1029/2006JG000181

[26] Burrows, W. R., Kochtubajda, B. and Fricska, G. (2025). Cloud-to-Ground Lightning Trends in Canada and Regions of the United States North of 40°N 1999-2023. Atmos.-Ocean, 63(2), 125–146. https://doi.org/10.1080/07055900.2025.2500648

[27] Tan, X., Gan, Y. G and Shao, D. (2016). Wavelet analysis of precipitation extremes over Canadian ecoregions and teleconnections to large-scale climate anomalies. J. Geophys. Res., 121(24), 14,469-14,486. https://doi.org/10.1002/2016JD025533

[28] Suchy, K. D., Allen, S. E., Sastri, A. R. and Young, K. V. (2026). Modelling the impacts of marine heatwaves on plankton in the Salish Sea, Biogeosciences, 23, 4667–4689. https://doi.org/10.5194/bg-23-4667-2026

[29] Basu, S., Sauchyn, D. J. and Anis, M. R. (2020). Hydrological Extremes in the Canadian Prairies in the Last Decade due to the ENSO Teleconnection—A Comparative Case Study Using WRF. Water, 12(11), 2970. https://doi.org/10.3390/w12112970

[30] Shabbar, A., Bonsal, B. R. and Szeto, K. (2011). Atmospheric and Oceanic Variability Associated with Growing Season Droughts and Pluvials on the Canadian Prairies. Atmosphere-Ocean, 49(4), 339–355. https://doi.org/10.1080/07055900.2011.564908

[31] Higuchi, K., Yuen, C. and Shabbar, A. (2000). Ice Storm ’98 in Southcentral Canada and Northeastern United States: A Climatological Perspective. Theor. Appl. Climatol. 66, 61–79. https://doi.org/10.1007/s007040070033

[32] Legault, S., Plouffe-Leboeuf A., Houle D., Blondlot A., Chase, L., Kuehn, D. and Perkins, T. (2018). Production de sirop d’érable face aux changements climatiques : Perceptions des acériculteurs du Canada et des États-Unis. Montréal, Québec : Ouranos, 36 p. https://www.ouranos.ca/sites/default/files/2022-07/proj-201419-rforest-houle-docvulgarisation.pdf

[33] National Oceanic and Atmospheric Administration. (June 2, 2026). How does El Niño Impact Atlantic Hurricane Season. Atlantic Oceanographic & Meteorological Laboratory. https://www.aoml.noaa.gov/how-does-el-nino-impact-atlantic-hurricane-season

[34] Ning, L. and Bradley, R. S. (2015). Winter Climate Extremes over the Northeastern United States and Southeastern Canada and Teleconnections with Large-Scale Modes of Climate Variability. J. Climate, 28, 2475–2493. https://doi.org/10.1175/JCLI-D-13-00750.1

[35] The Canadian Press. (May 23, 2025). 2024 sees record warm temperatures, less sea ice cover in Gulf of St. Lawrence. CBC News. https://www.cbc.ca/news/canada/nova-scotia/2024-sees-record-warm-temperatures-and-less-ice-gulf-of-st-lawrence-1.7542659

[36] Gan, R., Huang, G. and Hu, K. (2023). The Diverse Impacts of El Niño on Northeastern Canada and Greenland Surface Air Temperatures. J. Climate, 37, 335–348. https://doi.org/10.1175/JCLI-D-22-0677.1

[37] Wilkin, D. (January 2, 1998). El Nino and Nunavut: colder weather. Nunatsiaq News. https://nunatsiaq.com/stories/article/el_nino_and_nunavut_colder_weather

[38] Holmes, T. (December 5, 2023). El Niño heads north: how tropical weather affects the Arctic. CBC News. https://www.cbc.ca/news/canada/north/el-niño-heads-north-how-tropical-weather-impacts-the-arctic-1.7047217

Jump back to top