Explore new decadal forecasts on the map, and learn more about how to interpret and use them in our latest Learning Zone and News articles.

What Are Decadal Forecasts?

Learn about the decadal forecasts on ClimateData.ca and where you can find more information about these forecasts.

Module

Seasonal to decadal forecasts

Format

Article

Time to completion

15 minutes

Key Messages

Decadal forecasts on ClimateData.ca:

  • predict how climate conditions over the next 5 to 10 years are likely to compare to past conditions
  • are available for two consecutive 5-year periods within the next 10 years and are updated annually
  • do not predict daily or weekly weather, or conditions for an individual month or season

Decadal forecasts on ClimateData.ca

Decadal forecasts on ClimateData.ca summarize predictions of how climatic conditions (e.g., mean temperature and total precipitation) over the next 10 years are likely to compare to past conditions. They do not predict daily or weekly weather, or conditions for an individual month or season. They are available as averages aggregated within two consecutive 5-year periods for:

  1. Warmer months (May to September)
  2. Cooler months (November to March)
  3. All months (January to December)

The forecasts are updated annually (typically released before the end of March) and only the most recent forecasts are available. For example, in 2026, the two 5-year periods available are 2026 to 2030 and 2031 to 2035. In 2027, the decadal forecasts will be updated to cover 2027 to 2031 and 2032 to 2036.

These forecasts are probabilistic, meaning they provide the likelihood of different outcomes occurring. For example, a decadal forecast could provide the likelihood of a future 5-year period within the next 10 years being warmer or cooler than normal, or wetter or drier than normal. “Normal” is defined based on typical conditions over a 30-year historical reference period, using a historical climatology based on a reanalysis dataset that includes observations covering 1991 to 2020.

Decadal forecasts are produced using a climate model that simulates natural and human influences on the climate (see section Where does predictability come from at the decadal timescale?).

What are the uses and benefits of decadal forecasts?

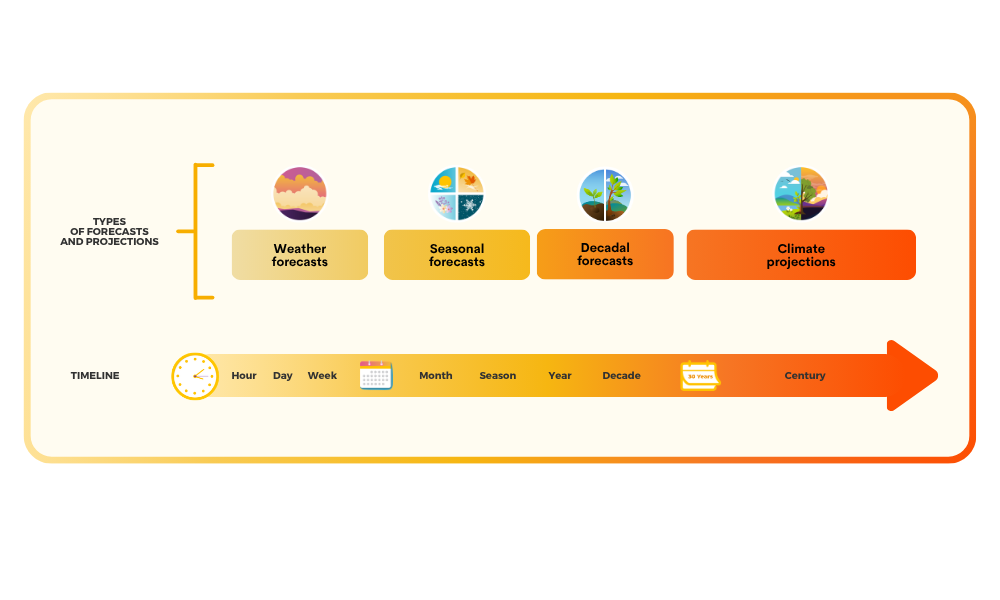
Decadal forecasts help bridge the gap between seasonal forecasts and longer-term climate projections (see Figure 1). Deciding when to use decadal forecasts is often determined by the timescale of interest, such as the lifespan of a project.

While seasonal forecasts are useful for planning for upcoming seasons in the next 12 months, decadal forecasts support planning over the next 5 to 10 years and climate projections are most appropriate for longer-term planning over multiple decades.

Decadal forecasts include the effects of human influenced climate change. However, unlike climate projections, they are not available for different emissions scenarios because differences between emissions scenarios are minimal over the upcoming 10 years.

Decadal forecasts predict timing of natural climate variability over the next 5 to 10 years reasonably well (e.g. Atlantic Multidecadal Oscillation) since they start from observed initial conditions. After about 10 years, this predictability declines, and confidence in the decadal forecasts decreases. For projects with lifespans of several decades or more, a combination of decadal forecasts (for the next 10 years) and climate projections (for 30-year periods to the end of the century) can be used to understand possible impacts throughout the lifetime of the project.

Figure 1: Shows the different timescales from weather forecasts to climate projections. Decadal forecasts cover the timescale between seasonal forecasts and climate projections and provide forecasts covering the next 10 years.


Planners and decision makers can use decadal forecasts as they weigh the benefits and risks of different actions. Ideally, probabilities for all outcomes (e.g., above-normal, near-normal, and below-normal conditions) would be considered, however, there is still benefit to basing decisions on the most probable outcome from each forecast compared to decisions based solely on the past.

Why are decadal forecasts shown as probabilities?

It is not possible to predict climate conditions for specific future periods that are years away with the same accuracy as weather forecasts. Instead, the decadal forecast model uses a collection of model simulations called an ensemble. The climate model is run 40 times, each time with a slightly different initial condition. Each model simulation represents a time-evolving prediction of possible future conditions. The ensemble is used to calculate the probability of different possible outcomes (e.g. the probability of conditions being above, near, or below normal) at each location for each upcoming 5-year period over the next 10 years. This type of forecast is called a probabilistic forecast.

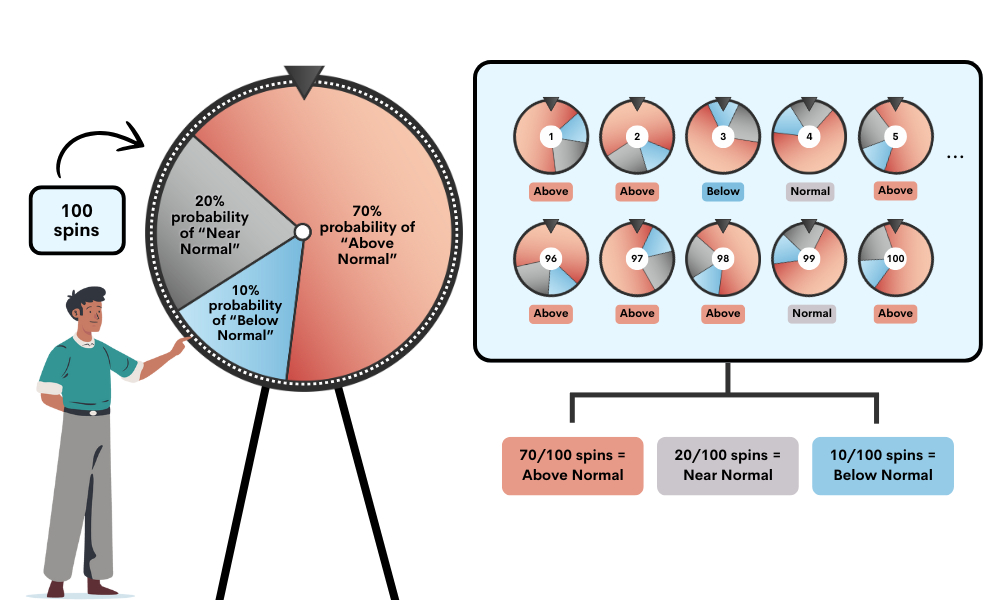
For example, say a forecast shows a 70% probability of above-normal precipitation, a 20% probability of near-normal precipitation, and a 10% probability of below-normal precipitation. This forecast can be interpreted as a 70 in 100 chance of experiencing above-normal precipitation, a 20 in 100 chance of experiencing near-normal precipitation, and a 10 in 100 chance of experiencing below-normal precipitation. The actual conditions that occur (i.e., that are ultimately observed and experienced) will not always match the forecast outcome with the highest probability. The forecast model would not be considered “wrong” in this example if a near-normal or below-normal outcome occurred, because while these outcomes are less probable, they are not impossible and are expected to occur some of the time (see Figure 2).

Figure 2: Probabilistic decadal forecasts can be understood by considering a wheel spinner analogy. Each section of the wheel represents one possible outcome. The wheel spinner example here represents a decadal forecast that predicts a 70% probability of an above-normal outcome, a 20% probability of a near-normal outcome, and a 10% probability of a below-normal outcome. Results from spinning the wheel many times are shown on the right (in the light blue section), these represent the actual ‘observed’ outcomes. Note the pointer (small grey triangle) on the wheel spinner lands on different outcomes over the course of many spins.

What do decadal forecasts look like on ClimateData.ca?

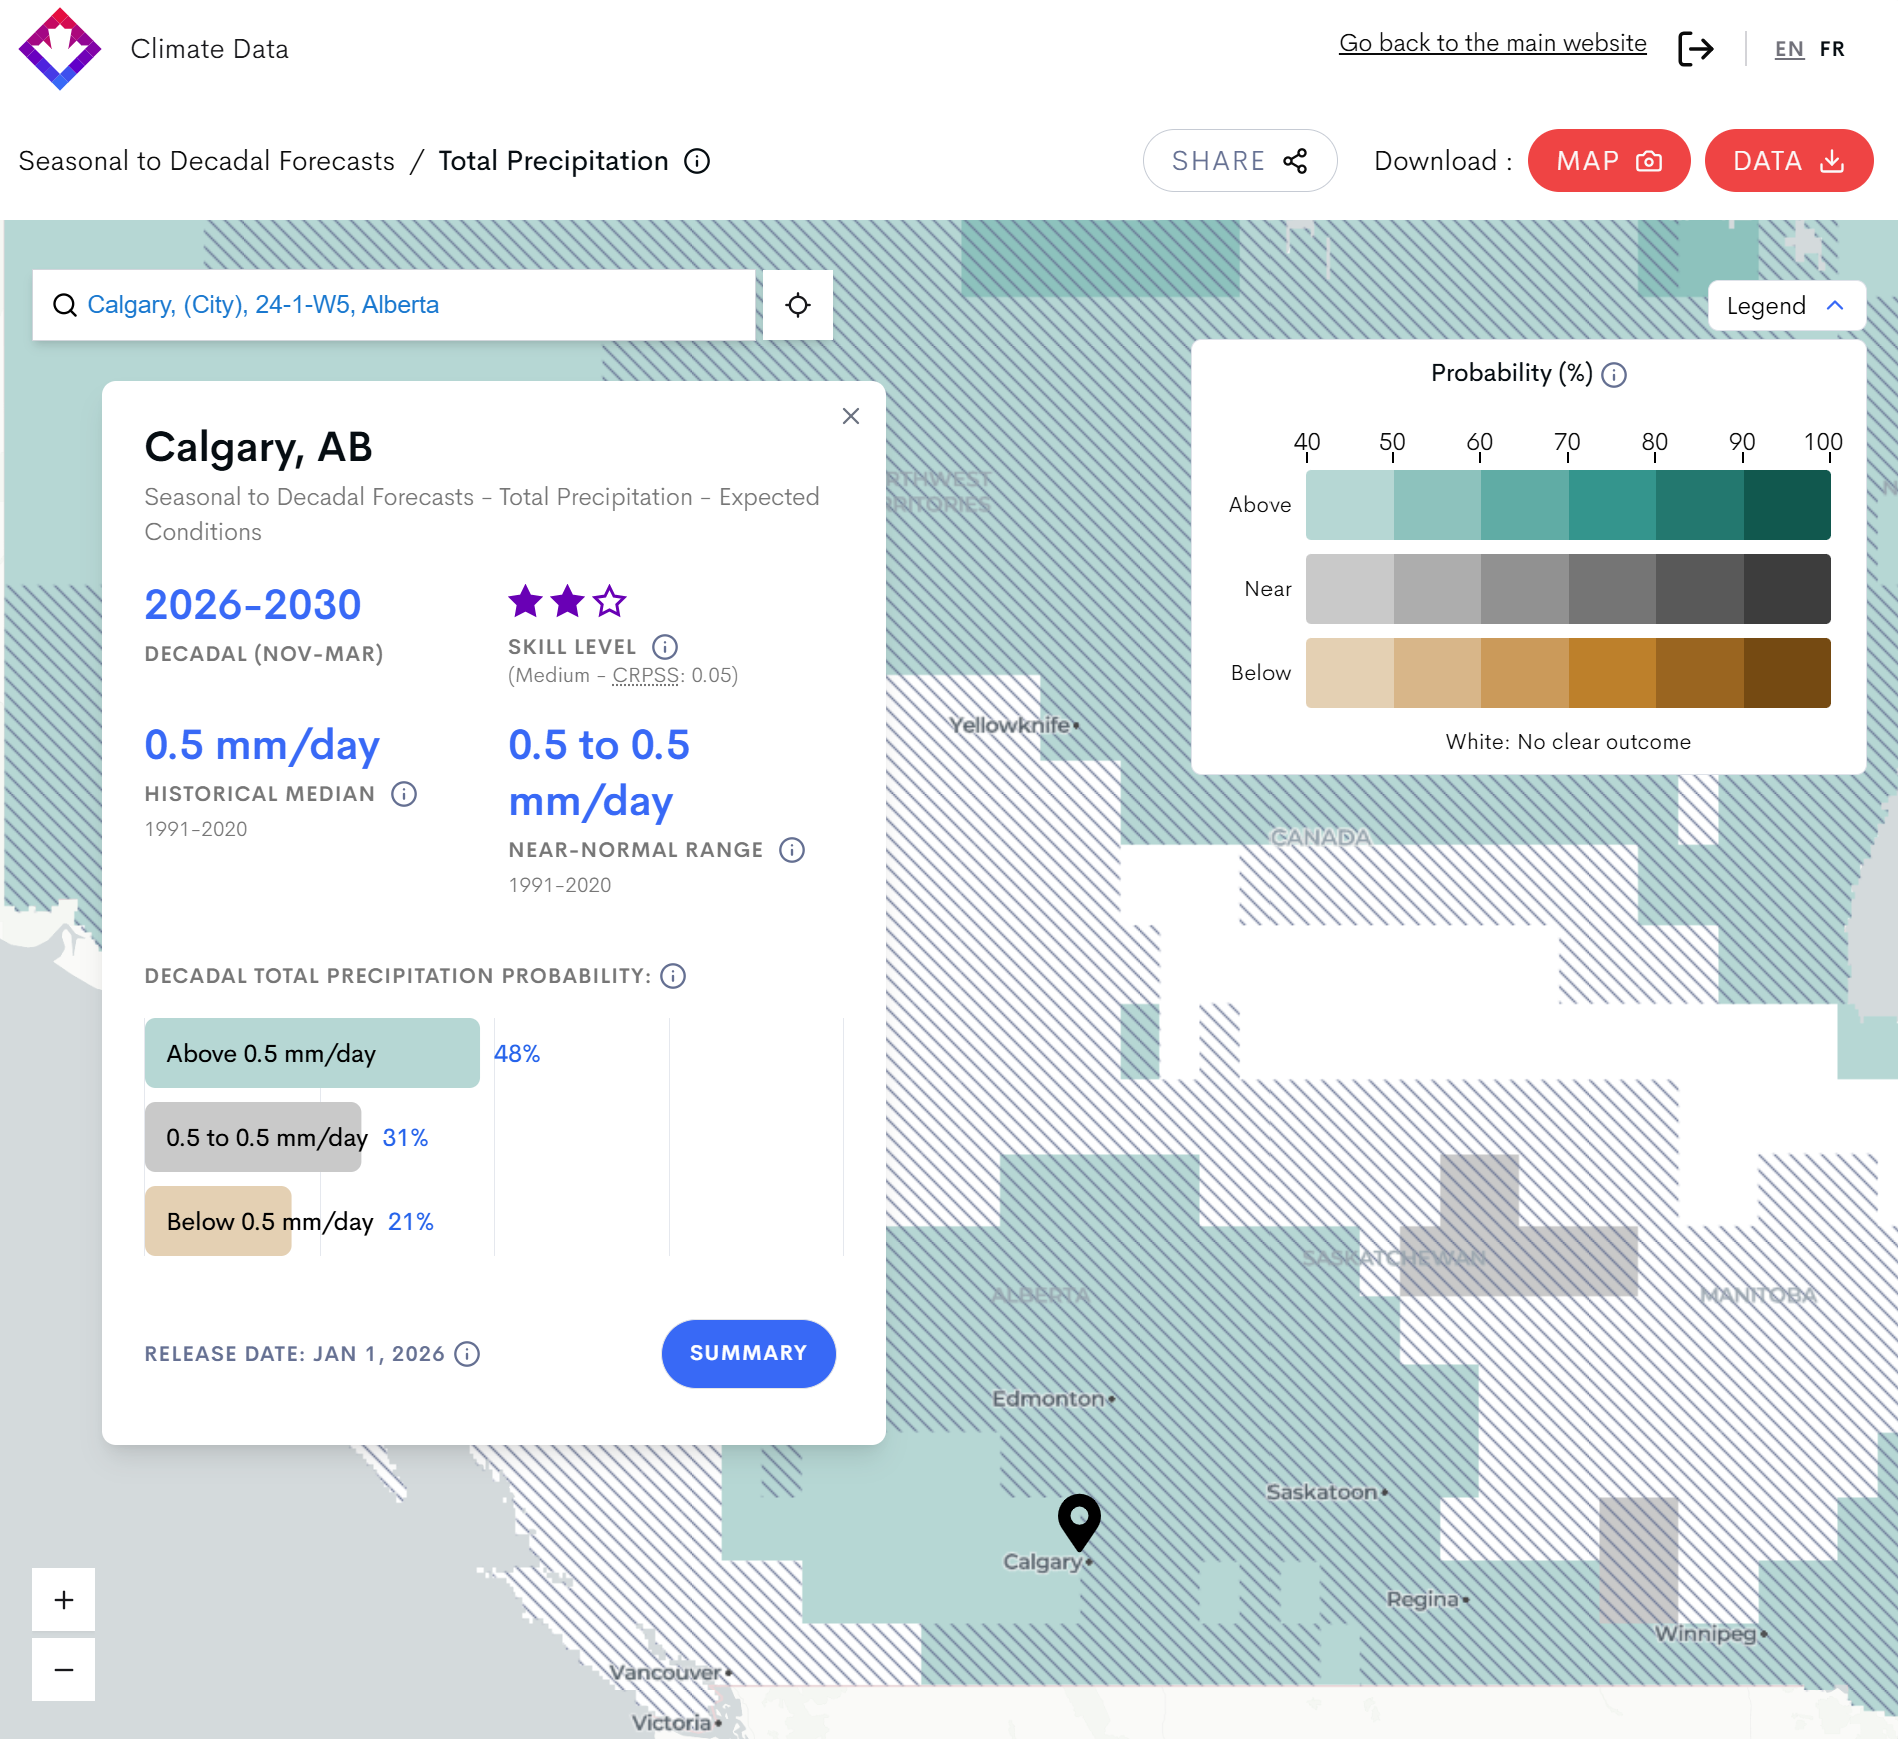
Decadal forecasts on ClimateData.ca are presented on a map showing the most probable outcome at each location. When a location is selected, probabilities for all outcomes are displayed (see Figure 3).

Two types of forecasts are available:

  1. Expected conditions: Indicate if future conditions are expected to be above, near, or below normal. For example, these forecasts provide the likelihood of a 5-year period being warmer or cooler than normal, or wetter or drier than normal, where normal is defined based on historical climate conditions over 1991 to 2020.
  2. Unusual conditions: Indicate the probability of future conditions being unusually high or unusually low. For example, these forecasts describe how likely it is that a 5-year period will be unusually warm or cool, or unusually wet or dry, compared to historical climate conditions over 1991 to 2020.

Figure 3: A screenshot of a decadal forecast of expected conditions for precipitation for Calgary, Alberta from ClimateData.ca. The expected conditions forecasts show above-normal, near-normal and below-normal conditions.

Where does predictability come from at the decadal timescale?

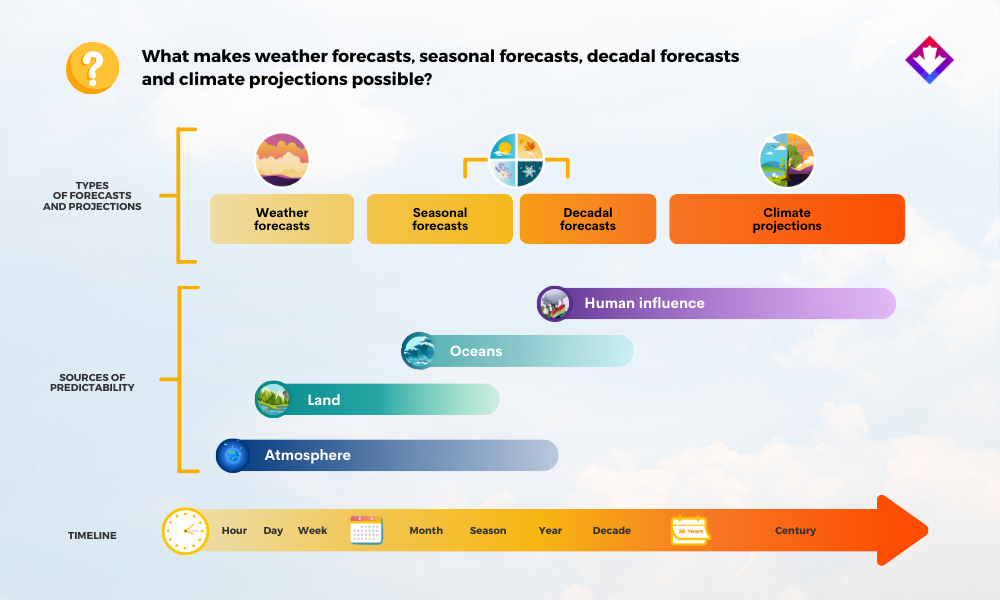
The climate system is mainly influenced by interactions between the atmosphere, land, oceans, and human activities. These influences evolve over timescales ranging from days to centuries and provide the predictability that enables weather and climate models to produce weather forecasts, seasonal forecasts, decadal forecasts, and climate projections, as shown in Figure 4. Different sources of predictability influence the weather and climate on different timescales (e.g., days, seasons, decades).

Decadal forecasts are largely influenced by changes in the state of the ocean, including natural climate variability. Sea surface temperature variability in the Atlantic and Pacific oceans (e.g., Atlantic Multidecadal Oscillation) provides an important source of predictability on decadal timescales [1].Decadal forecasts are also affected by human influences such as greenhouse gas emissions and aerosols. Further information about aerosols can be found in the Aerosols and their Climate Impacts article.

To predict how climate influences will evolve over the coming decade, the decadal forecast model uses information about present day climate conditions to start (initialize) the model run and then runs forward in time. Decadal forecasts are not produced for different Shared Socio-economic Pathways (SSPs) because differences between SSPs are minimal within the upcoming 10-year period. Instead, forecasts are made using greenhouse gas emissions from the single SSP2-4.5 emissions scenario [2].

Figure 4: Atmosphere, land, oceans, and human influence affect the climate on timescales ranging from days to centuries; however, their influences are felt more strongly at different timescales. Weather and climate models use these sources of predictability to produce weather forecasts, seasonal forecasts, decadal forecasts, and climate projections. Figure adapted from [1].

High probabilities for above-normal temperature and precipitation

Decadal forecasts for mean temperature indicate that above-normal temperatures are the most likely outcome for all regions of Canada over the next 10 years. This is largely due to human influence on climate change, which is more apparent in decadal forecasting than in seasonal forecasting. Because decadal forecasts cover longer time periods, they capture human influence more strongly, as shown in Figure 4 above.

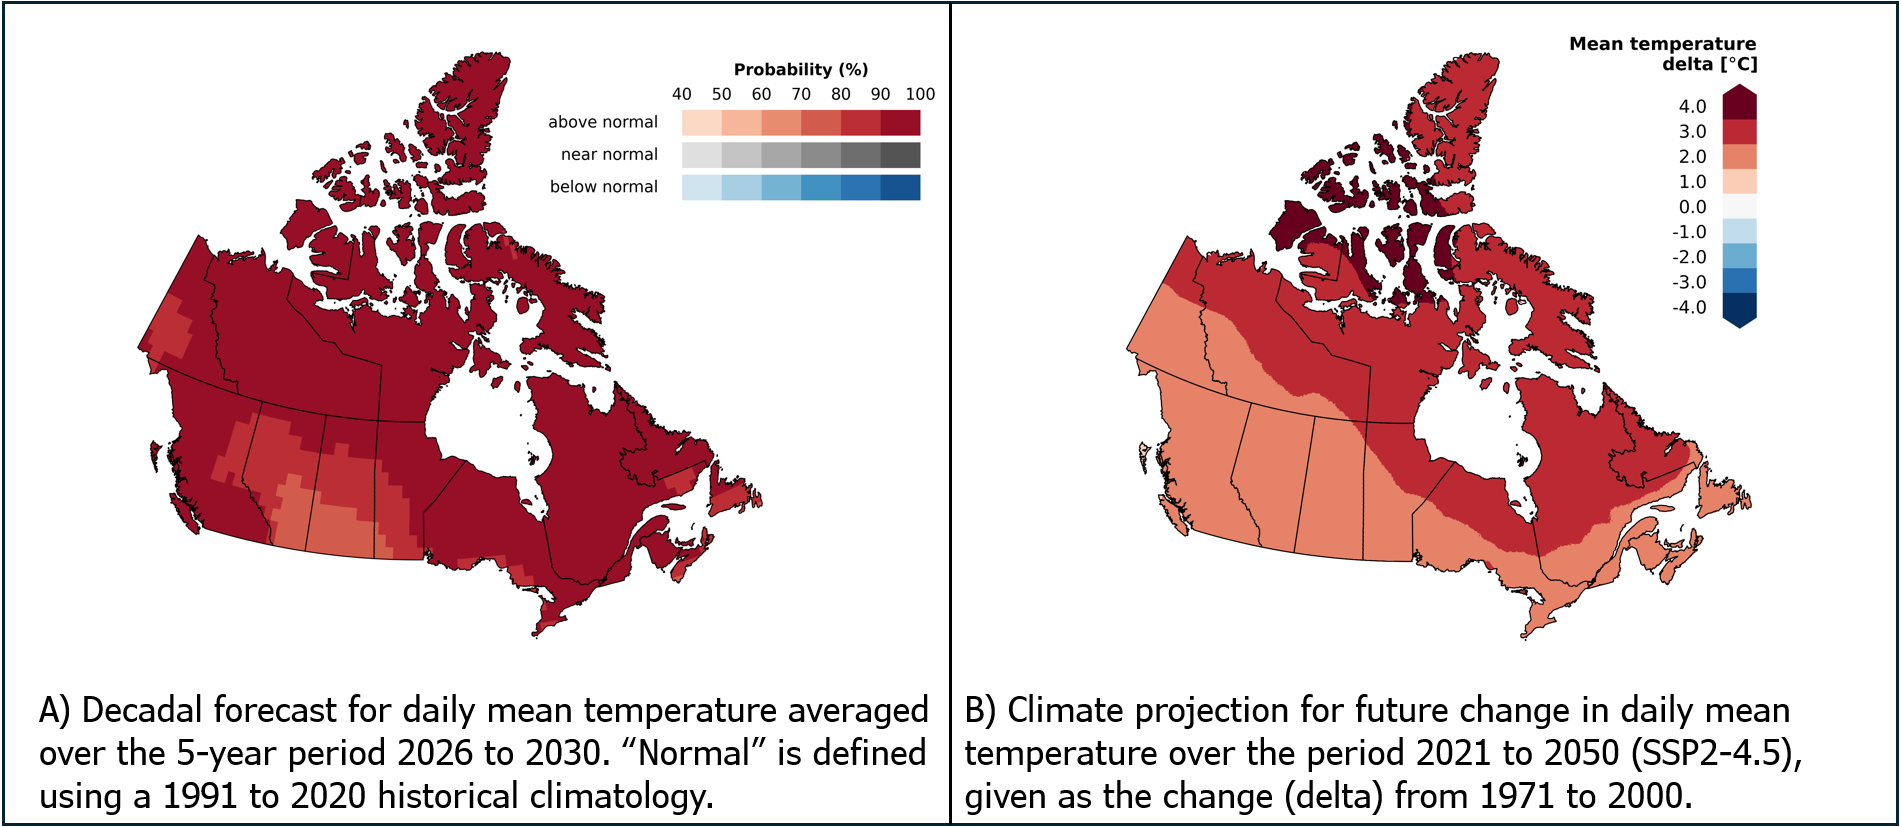
Figure 5 compares a decadal forecast for daily mean temperature for 2026 to 2030 with a climate projection for future changes in daily mean temperature averaged over the 2021 to 2050 period (using SSP2-4.5 for demonstration purposes). The decadal forecast on the left indicates above-normal temperatures are the most likely outcome across Canada.

Similarly, the climate projection on the right shows the projected change in temperature over 2021 to 2050 relative to the baseline period across Canada. Warming temperatures are projected across all regions. These maps both capture warming in Canada due to climate change, but over different time frames; not only is the decadal forecast for a shorter time period that is closer to the present, but it also includes the predicted effect of natural climate variability over the next 5 years.


Figure 5: The maps above show expected warming for decadal and 30-year time periods. Map A) shows a decadal forecast for daily mean temperature for 2026 to 2030, showing above-normal temperatures are the most likely outcome across Canada. Map B) shows a climate projection of future changes in daily mean temperature for 2021 to 2050 (using SSP2-4.5), showing warming is projected across Canada.

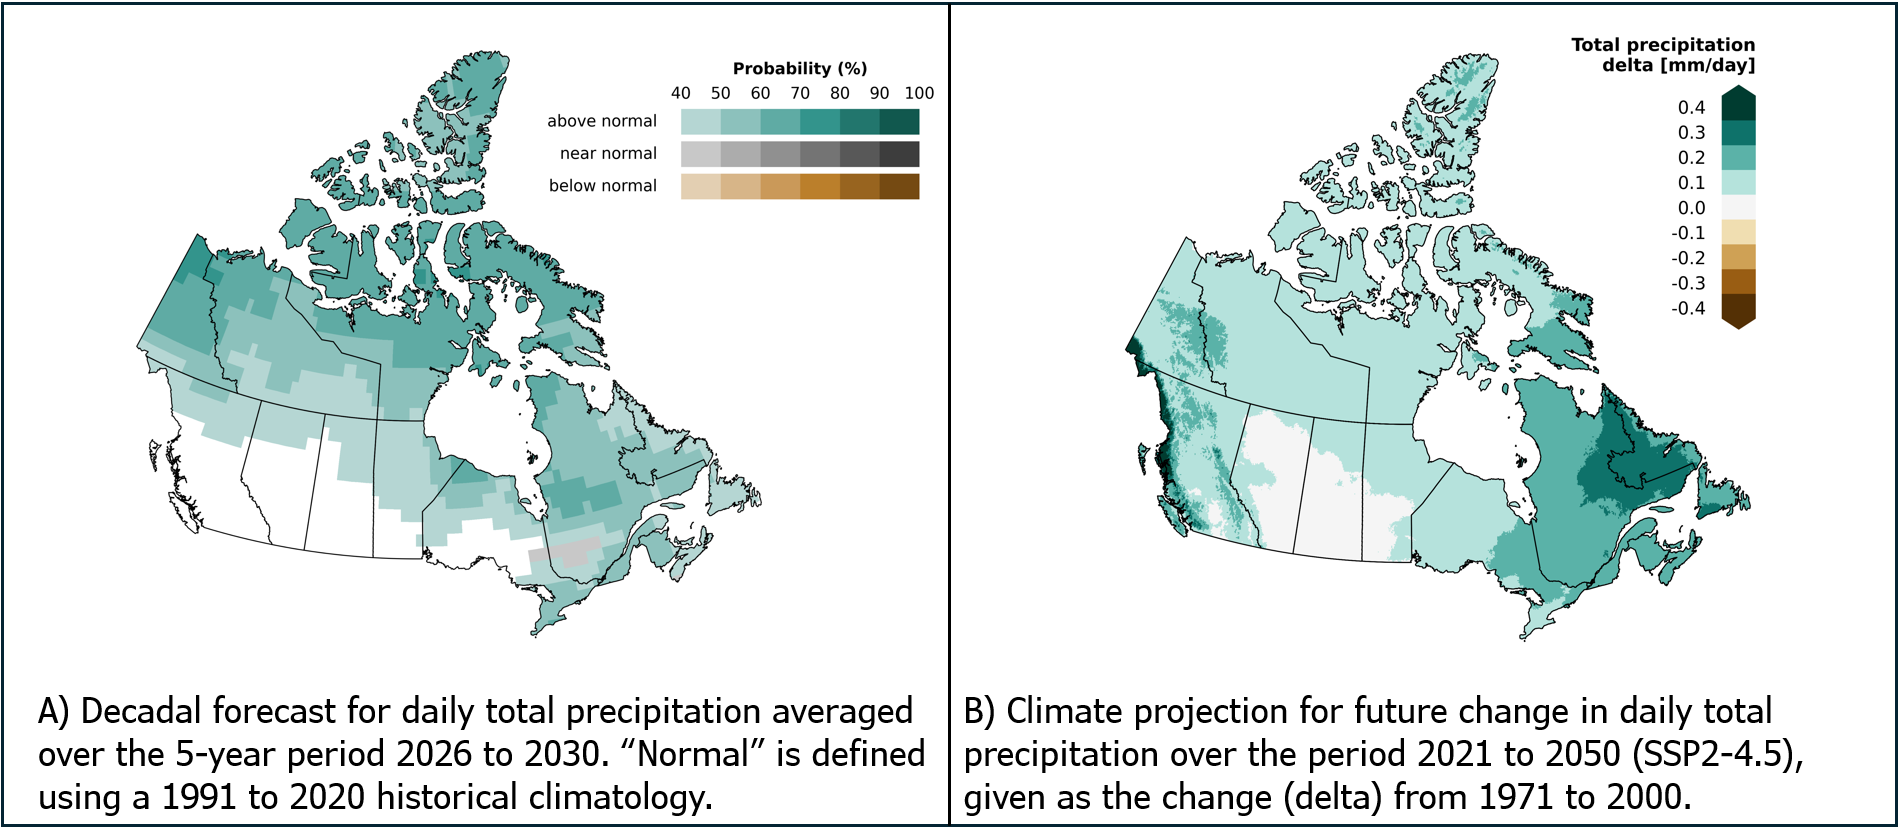
Figure 6 shows the same comparison for precipitation. The decadal forecast on the left shows above-normal precipitation is the most likely outcome for most of Northern, Central, and Atlantic Canada. The 30-year climate projection on the right shows increased total precipitation for British Columbia and Northern, Central, and Atlantic Canada. Generally, precipitation has been increasing already across much of Canada in recent decades due to climate change, though with large differences between regions [3].


Figure 6: Map A) shows a decadal forecast for daily total precipitation for 2026 to 2030, showing above-normal precipitation is the most likely outcome for most of Northern, Central and Atlantic Canada. Map B) shows a climate projection of future changes in daily total precipitation for 2021 to 2050 (using SSP2-4.5), showing increasing precipitation is projected for the British Columbia and Northern, Central, and Atlantic Canada.

Decadal forecast uncertainty

Uncertainty is inherent to any prediction. In the context of prediction, ‘uncertain’ does not mean ‘speculative’, rather, it indicates that while the scientific understanding of many climate processes is well established and informs the development of robust forecasts, our knowledge of future climatic conditions is incomplete. Many of the sources of uncertainty associated with seasonal forecasts (see the Considering Uncertainty in Seasonal Forecasts article) and climate projections (see the Uncertainty in Climate Projections article) also affect decadal forecasts.

Uncertainty in decadal forecasts is primarily caused by a combination of the following factors:

Limits on the predictability of climate on decadal timescales

Predictability of climate is limited by inherently chaotic natural variability. Some parts of the climate system, such as the oceans, vary more slowly, allowing for predictability on decadal timescales. Other parts of the climate system, such as the atmosphere, vary more rapidly, reducing predictability over longer timescales. See the section ‘Where does predictability come from at the decadal timescale?’ for more information.

Uncertainty in the initial conditions

Each model simulation used in the decadal forecast starts from an initial condition that is based on recent climate observations. These observations are subject to some uncertainty due to measurement errors and observational gaps in time and space.

Uncertainty due to limitations of the decadal forecast model

Models are numerical representations of the processes that govern the state of the atmosphere, land, ocean and sea ice. While these models simulate important physical processes that determine weather and climate, they approximate or do not include some physical processes that can affect weather and climate. As a result, these models provide a good, but not perfect, representation of the weather and climate system.

The skill of the decadal forecast model is assessed to help quantify model performance, influenced by all of these sources of uncertainty. Skill is assessed based on how forecasts performed over a historical period relative to what actually occurred. Skill metrics provide decision-makers with additional context to help interpret the forecast for the location of interest. On ClimateData.ca, skill is provided with each forecast.


Technical Note

Skill on ClimateData.ca is calculated using the Continuous Ranked Probability Skill Score (CRPSS) performance metric. Skill for the first 5-year period (years 1 to 5) is assessed using all 26 overlapping 5-year forecasts covering the historical 1996 to 2025 time period. Skill for the second 5-year period (years 6 to 10) is assessed using all 16 overlapping 5-year forecasts covering the 2006 to 2025 time period.

How are the decadal forecasts on ClimateData.ca developed?

The decadal forecasts on ClimateData.ca are generated using version 5 of the Canadian Earth System Model (CanESM5), a global climate model developed by Environment and Climate Change Canada (ECCC) [2].

The decadal forecasts are produced on a spatial grid of 1o x 1o (~ 110 km x 60 km). However, the interactive map on ClimateData.ca has a spatial grid of roughly 0.1o x 0.1o (~ 10 km x 6 km), matching the approximate resolution of the historical climatology that is provided with the forecast. While each map grid cell will have different values from the historical climatology, the forecast will cover a larger area. The historical climatology is from the Canadian Surface Reanalysis dataset. Technical documentation on CanESM5 provides additional information.

More decadal forecast information for Canada

In addition to ClimateData.ca, ECCC’s Canadian Climate Data and Scenarios (CCDS) and the World Meteorological Organization (WMO) provide decadal forecast information that is updated annually. Table 1 describes the decadal forecasts available on each portal.

Table 1: A summary of key details for the decadal forecasts available on ClimateData.ca, ECCC’s CCDS website, and the WMO website. Access each portal to see a complete list of variables and indices offered.

Portal linkForecast typeForecast periodsSpatial coverageModel ensembleAre forecasts calibrated1?Are skill metrics displayed?
ClimateData.ca
  • Probabilistic forecast for above, near, and below normal conditions
  • Probabilistic forecast for unusually high and unusually low conditions
Averages over two consecutive 5-year periods in the next 10 years for:
  • All months (January to December)
  • Warmer months: May to September
  • Cooler months: November to March
  • Resolution: 1ox 1o
  • Canada-wide
  • Historical climatology is provided at: ~0.1ox 0.1o resolution
Single model (CanESM5)Yes [4]Yes
ECCC’s CCDS Decadal forecasts for Canada website, technical documentation and user guide
  • Forecasts of temperature and precipitation change (anomaly forecasts)
  • Annual and seasonal averages over rolling 5-year periods
  • Resolution: 1ox 1o
  • Canada-wide
Multi-model ensemble percentiles (using the same models as the WMO designated Global Producing Centres and other contributing centres, including CanESM5)NoNo
WMO website
  • Anomaly forecasts
  • Probabilistic forecasts for above average and below average conditions
Average over the current year, upcoming 5-year period, and upcoming 10-year period for:
  • All months (January to December)
  • Warmer months: May to September
  • Cooler months: November to March
  • Resolution: 1o x 1o
  • Global
Multi-model (including CanESM5)NoYes

References

[1] Merryfield, W.J., Baehr, J., Batté, L., Becker, E.J., Butler, A.H., Coelho, C.A.S., Danabasoglu, G., Dirmeyer, P.A., Doblas-Reyes, F.J., Domeisen, D.I.V., Ferranti, L., Ilynia, T., Kumar, A., Müller, W.A., Rixen, M., Robertson, A.W., Smith, D.M., Takaya, Y., Tuma, M., Vitart, F., White, C.J., Alvarez, M.S., Ardilouze, C., Attard, H., Baggett, C., Balmaseda, M.A., Beraki, A.F., Bhattacharjee, P.S., Bilbao, R., de Andrade, F.M., DeFlorio, M.J., Díaz, L.B., Ehsan, M.A., Fragkoulidis, G., Gonzalez, A.O., Grainger, S., Green, B.W., Hell, M.C., Infanti, J.M., Isensee, K., Kataoka, T., Kirtman, B.P., Klingaman, N.P., Lee, J.Y., Mayer, K., McKay, R., Mecking, J.V., Miller, D.E., Neddermann, N., Ng, C.H.J., Ossó, A., Pankatz, K., Peatman, S., Pegion, K., Perlwitz, J., Recalde-Coronel, G.C., Reintges, A., Renkl, C., Solaraju-Murali, B., Spring, A., Stan, C., Sun, Y.Q., Tozer, C.R., Vigaud, N., Woolnough, S., & Yeager, S. (2020). Current and Emerging Developments in Subseasonal to Decadal Prediction. Bulletin of the American Meteorological Society, 101(6), E869-E896. https://doi.org/10.1175/BAMS-D-19-0037.1

[2] Sospedra-Alfonso, R., Merryfield, W.J., Boer, G.J., Kharin, V.V., Lee, W., Seiler, C., & Christian, J.R. (2021). Decadal climate predictions with the Canadian Earth System Model version 5 (CanESM5). Geoscientific Model Development, 14(11), 6863-6891. https://doi.org/10.5194/gmd-14-6863-2021

[3] Wang, X.L., Zwiers, F.W., Kirchmeier-Young, M., Feng, Y., Gillett, N. & Qian, B. (2026). Overview of past changes in climate. In Canada’s Changing Climate Report 2026. Government of Canada. https://www.canada.ca/en/environment-climate-change/services/science-technology/changing-climate-report-2026/cccr-chapter-2-en.html

[4] Kharin, V.V., Merryfield, W.J., Boer, G.J., & Lee, W.-S. (2017). A Postprocessing Method for Seasonal Forecasts Using Temporally and Spatially Smoothed Statistics. American Meteorological Society, 145(9), 3545-3561.https://doi.org/10.1175/MWR-D-16-0337.1