Climate Data in Action: Outdoor skating rinks in Canada

Using ClimateData.ca to study the impacts of climate change on outdoor skating rinks in Canada

Originally published: February 2, 2024. Revised: February 27, 2024.


Canada’s love for outdoor skating runs deep. From its historical roots dating back hundreds of years to today, ice skating remains a cherished pastime for people of all ages. Outdoor ice skating is a part of Canada’s culture and identity. Notable hockey players like Gordie Howe, Maurice Richard, Sidney Crosby, and Wayne Gretzky all sharpened their skating skills on frozen ponds and backyard rinks in Canada.

Outdoor ice skating isn’t just another sport, it provides a sense of community. Skating often acts as a place for social gatherings and events. Outdoor rinks often provide free access and attract people of all ages, incomes, genders. A study from the University of Guelph showed that having outdoor rinks in a city can improve a city’s social life, generating a relaxed and playful setting for people to connect (Horgan et al., 2020). Moreover, skating gives children who cannot afford hockey or skating lessons a chance to try something new.

How does climate change impact outdoor skating rinks?

The changing climate in Canada has resulted in warmer winters, which have impacted outdoor skating seasons across the country. Natural outdoor skating rinks (that is to say, unrefrigerated rinks) require, above all else, consistent temperatures below the freezing point. Climate change, however, means warmer temperatures for Canada, challenging the assumption that our winters will have temperatures consistently below freezing. Warmer temperatures can lead to additional climate changes, including rain, which can degrade ice. Adding to this are existing risks from phenomena like El Niño, which generally have a major impact on the beginning and end of the skating season.


Canada’s climate is warming at double the rate of the global average (Zhang et al., 2019). Moreover, winter temperatures in Canada have warmed the most out of any other season, rising 3.4°C over the past 75 years (from 1948-2023) (Environment and Climate Change Canada, 2023). There are more frequent and longer lasting warm spells, and there have been changes in ice cover across the country. Studies have shown that small lakes across southern Quebec, Ontario, Manitoba, and Saskatchewan are breaking up earlier and freezing up later (Brown and Duguay, 2010), and river ice has been breaking up earlier across all of Canada from 1950-2016 (Chen and She, 2020).

As potential evidence of this trend, the Rideau Canal in Ottawa has witnessed an average decline in its outdoor skating season (OSS) of about 6.8 days per decade​ between 1971 and 2024 (Figure 1). The longest skating season on the Rideau Canal was in the winter of 1971-72 (National Capital Commission, n.d.), with 91 days of skating. In contrast, in the past ten years, the Rideau Canal has had an average OSS of 37 days per year, representing a reduction of over 50% since the early 1970s. In 2022-2023, for the first time in its history, the canal never opened for skating. This year, the canal opened sporadically, for a total of 10 days.

Figure 1: The number of days the Rideau Canal Skateway was open (1971 to 2024). Source: National Capital Commission, n.d. Note: 2024 data is not official (see Ottawa Citizen, 2024).

Warming Winters: A look at 2023-2024

This winter (2023-2024), an El Niño in the tropical Pacific Ocean is resulting in warmer than normal temperatures across much of the planet, Canada included. During these types of events, Canada often experiences warmer than usual winters. Environment and Climate Change Canada’s (ECCC) seasonal forecast indeed shows that during this winter season (from January to March 2024), daily mean temperatures are expected to continue to be warmer than average across the country (Figure 2).  For example, Toronto, Calgary, and Montréal are all expected to have at least a 55% chance of experiencing above normal temperatures for January, February, and March than the 1991-2020 climate normal, likely making the outdoor skating season shorter across these three cities. Areas near the Pacific Ocean, lower Lake Superior, the Atlantic Ocean, and Hudson’s Bay have a 90% chance or higher of being warmer than average this winter season.​

ECCC scientists are continuously improving the seasonal forecast system and developing an expanded suite of user-friendly forecast products. In the coming years, additional forecast products will help answer questions like “how much warmer is this winter forecasted to be?”. Meanwhile, we invite you to consult the seasonal probabilistic forecasts available on ECCC’s website. For more information on how to interpret seasonal probabilistic forecasts, consult ECCC’s User guide for seasonal forecasts.


Figure 2: Environment and Climate Change Canada’s Seasonal Forecast for this winter season (January, February, and March 2024). The map illustrates the probability of regions of Canada experiencing below (blue), near normal (purple-pink), and above normal (yellow to red) temperatures compared to the 1991-2020 winter average.

Future Climate Projections

The concern moving forward is how climate change will further impact future skating seasons in Canada. Using future climate projections found on ClimateData.ca, we investigated what the skating season could look like by the end of the century in Toronto, Calgary, and Montréal.

When assessing the impacts of climate change using future climate data, determining the most appropriate threshold to use (e.g., temperatures above or below a specific value) can be challenging. In this case, finding the appropriate threshold involves looking into existing research on the  weather conditions necessary to build and maintain skating rinks. For example, in one study on the effects of climate change on outdoor skating, the authors used an estimate of three consecutive days that had a maximum temperature at or below -5°C to best predict the beginning of the OSS (Damyanov et al., 2012). This threshold was determined based on interviews with rink operators across Canada. In another study on outdoor skating, the authors used a dataset containing rink operating days to determine that a 6-day maximum temperature of below -3°C was found to be the best predictor of outdoor skating availability in Montréal (Dickau et al., 2020). Finally, focusing on the long term viability of skating in North America, a third study conducted by McLeman et al. (2023) determined that “the most straightforward way to identify where North Americans are likely to construct outdoor skating rinks on a regular basis in future decades is to map changes in the location of the −5°C isotherm of average mean daily temperatures for the month of January.”

In consideration of these different approaches and thresholds, and for demonstration purposes in the context of this blog article, we opted to use instances of three days in a row with a mean temperature below -5°C in our analysis. For adaptation planning purposes, some additional interpretation may be required to select or adjust the threshold to the specific circumstances of the assessment.

Of note, ClimateData.ca’s Analyze Page currently allows users to extract data using custom thresholds for “mean” temperatures but not for “maximum” temperatures.


For users interested in running analyses using maximum temperature, in advance of the addition of this feature on the Analyze Page, we suggest using PAVICS, a climate data tool maintained by Ouranos for climate researchers and scientists (note: PAVICS requires programming capabilities) or contacting the Climate Services Support Desk.

1. Toronto

By the end of the century, Toronto could see zero of these cold spell days, at least under the highest emissions scenario, also known as “SSP5-8.5” (learn more about these scenarios by reading our learning zone article). This scenario, denoted by the red line on the plots below, describes a world where global temperatures could reach 5°C higher than the pre-industrial average by the end of this century. Under a much lower emissions scenario (also known as SSP1-2.6), denoted by the yellow line on the graphs below, Toronto could experience 15 cold spell days per year, a 50% reduction from what Toronto experiences now.

To further illustrate the magnitude of the climate changes projected for Toronto, we used ClimateData.ca’s Spatial Analogue Tool which identifies present-day locations in North America which share similar climate characteristics to a target city’s future climate projections. By selecting the highest emissions scenario (SSP5-8.5), the end of the century (2071-2100) time period, and “Heating Degree Days” and “Ice Days” as variables for input, the tool showed that Toronto’s winters could resemble characteristics of present-day Albuquerque, New Mexico. For reference, Alburquerque has a winter (December, January, February) average maximum temperature of 8.3°C (based on the 1991-2020 climate normal), which is 7.4°C warmer than Toronto’s 1991-2010 normal. To learn more about climate normals, and to explore your own community’s climate normals, visit Environment and Climate Change Canada’s Canadian Climate Normals Page

2. Calgary

The story is similar for Calgary. In the highest emissions scenario (red line), Calgary could experience about 20 cold spell days per year, a reduction of 40 days from the recent past. Under the lowest emissions scenario, Calgary could experience about 50 cold spell days per year.

According to the Spatial Analogues tool, using the same time frame, emission scenario, and variables used in the Toronto example, climate change could make winters in Calgary more closely resemble the present-day winters of Billings, Montana. Billings has a normal winter maximum temperature that is approximately 4°C warmer than Calgary’s 1981-2010 winter climate normal.

3. Montréal

Montréal could experience similar challenges as the climate warms. In the high emissions scenario, Montréal could experience an average of three cold spell days per year by the end of the century, a reduction of 57 days from the present day. In the lower emissions scenario, Montréal could experience about 40 cold spell days a year by 2100, or a 20-day reduction from present day.

According to the Spatial Analogue tool, Montréal’s winters could resemble the winters of Indianapolis, Indiana by 2100, under the high emissions scenario. The winter maximum temperature normal in Indianapolis is 3.7°C, 7.2°C warmer than Montréal’s 1981-2010 normal.

Increasing Climate Preparedness

In summary, the future of outdoor skating in Canada is challenged by climate change. Outdoor rinks are not only venues for physical activities but also play a crucial role in social and mental well-being and promoting community engagement across diverse groups. The rising temperatures in Canada, particularly during winter months, are adversely affecting the maintenance and viability of these rinks. Historical trends and climate projections indicate a reduction in the length of the outdoor skating season, exemplified by shorter and unpredictable operational periods for notable rinks like the Rideau Canal in Ottawa.

Seasonal forecasts for the remaining months of the 2023-2024 winter season indicate potential for continued above-seasonal temperatures, bolstered by the ongoing El Niño in the Pacific. Coupled with ongoing climate warming, this information points to further challenges for rink operators across the country. Future climate projections for major cities like Toronto, Calgary, and Montréal all point to fewer days of cold weather, even in a more optimistic low-carbon emission scenario, meaning these challenges will continue for years to come.

Given these challenges, it is essential to explore and implement adaptive strategies to sustain outdoor skating in Canada. This might include leveraging technological advancements in rink refrigeration, having multiple uses for rinks throughout the entire year (e.g., skating rink in the winter and rollerblading or biking in the summer), and enhancing community-led efforts to further invest in and to maintain rinks (e.g., at the Bentway skating rink in Toronto, the site offers local art exhibits, music festivals, and environmental education programs such as rainwater gardens to generate more community at the rink).

To preserve outdoor skating in Canada in a changing climate, we need to make climate-informed investments – to do this, we need to know what our future climate might look like in the near- and long-term. To find out what your community might experience in the future and to support climate-smart decisions when planning for these climate conditions, we encourage you to explore ClimateData.ca for more information, resources, and case studies.

References:

Brown, L. C., & Duguay, C. R. (2010). The response and role of ice cover in lake-climate interactions. Progress in Physical Geography: Earth and Environment, 34(5), 671-704. https://doi.org/10.1177/0309133310375653

Chen, Y., & She, Y. (2020). Long-term variations of river ice breakup timing across Canada and its response to climate change. Cold Regions Science and Technology176, 103091.

Damyanov, N. N., Matthews, H. D., & Mysak, L. A. (2012). Observed decreases in the Canadian outdoor skating season due to recent winter warming. Environmental Research Letters7(1), 014028.

Dickau, M., Matthews, D., Guertin, É., & Seto, D. (2020). Projections of declining outdoor skating availability in Montreal due to global warming. Environmental Research Communications2(5), 051001.

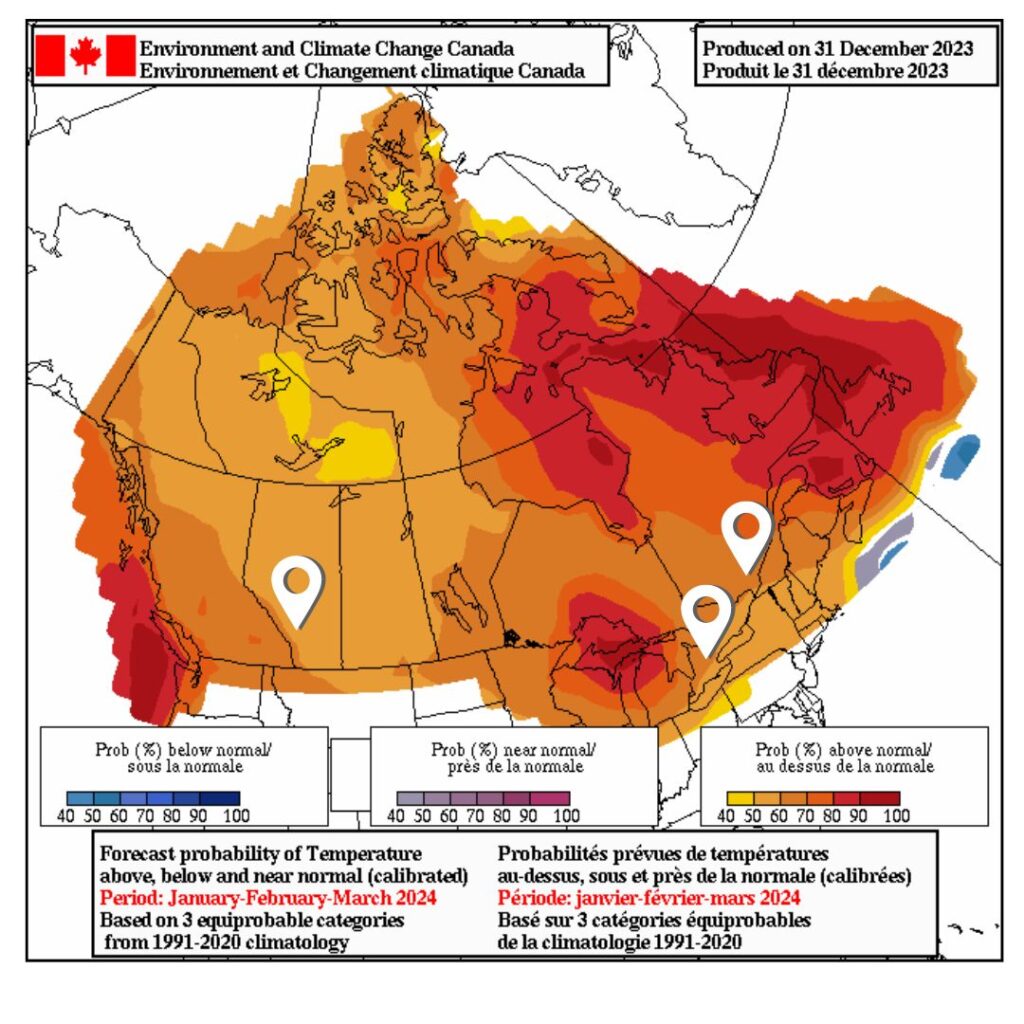
Environment and Climate Change Canada. 2023. Climate Trends and Variation Bulletin: Winter; 2022-2023. ISSN: 2367-9794

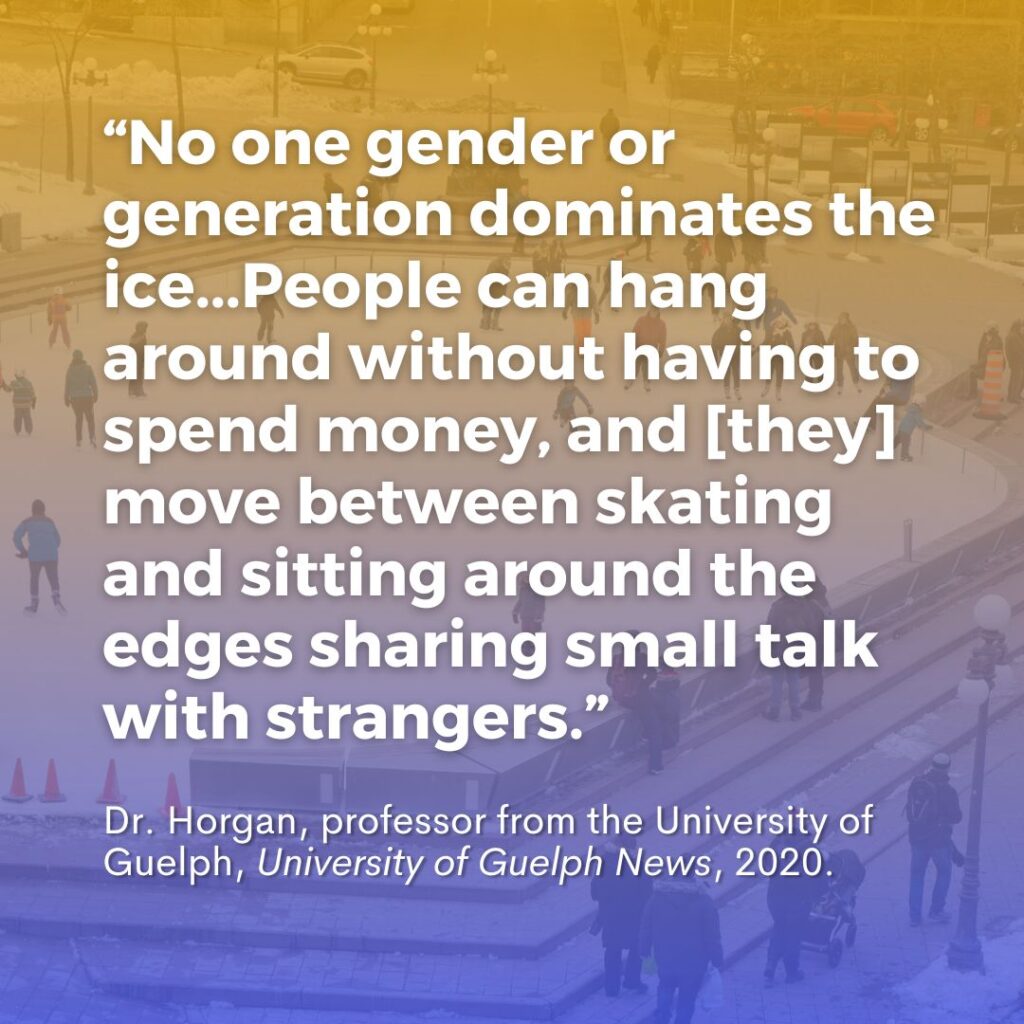
Horgan, M., Liinamaa, S., Dakin, A., Meligrana, S., & Xu, M. (2020). A shared everyday ethic of public sociability: Outdoor public ice rinks as spaces for encounter. Urban Planning5(4), 143-154.

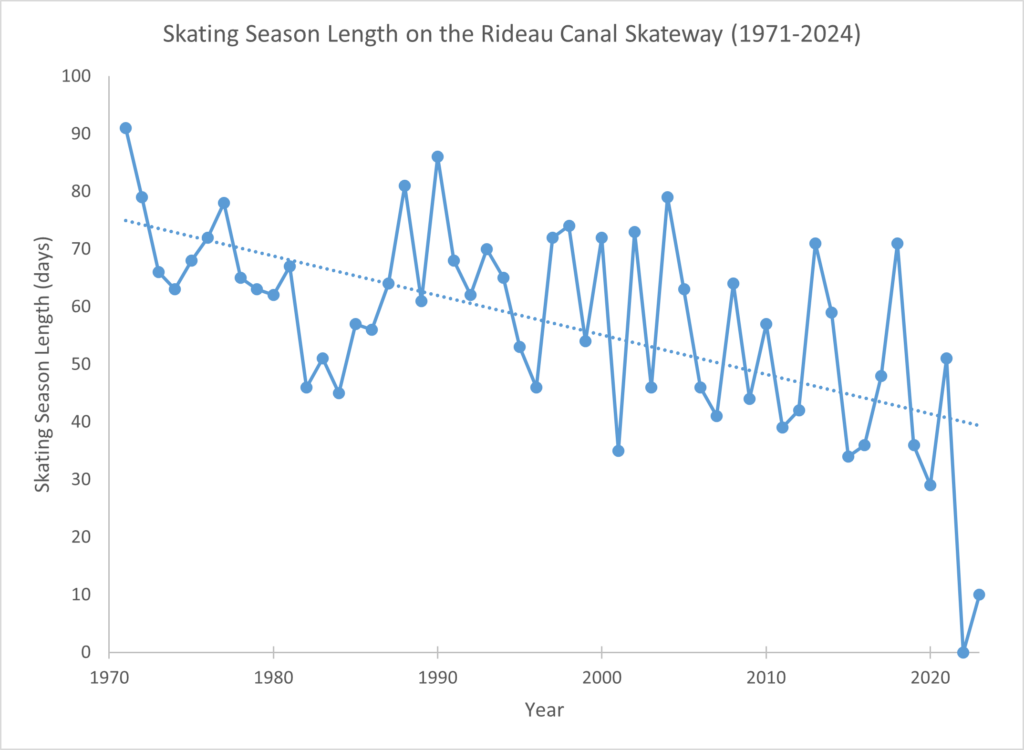
National Capital Commission. (N.d.). Rideau Canal Skateway – History of the Rideau Canal Skateway. Accessed January, 2024 from: https://ncc-ccn.gc.ca/places/history-rideau-canal-skateway

Ottawa Citizen. 2024. NCC closes Skateway for season. Accessed February 27, 2024 from: Skateway closes for the season Sunday at 10 p.m. | Ottawa CitizenZhang, X., Flato, G., Kirchmeier-Young, M., Vincent, L., Wan, H., Wang, X., Rong, R., Fyfe, J., Li, G., Kharin, V.V. (2019): Changes in Temperature and Precipitation Across Canada; Chapter 4 in Bush, E. and Lemmen, D.S. (Eds.) Canada’s Changing Climate Report. Government of Canada, Ottawa, Ontario, pp 112-193.