Transportation

Climate variability and change has, and will continue to have, vast impacts on all modes and facets of Canadian transportation systems. The transportation sector module of ClimateData.ca provides easy access to transportation-relevant climate datasets, information, and case studies demonstrating the use of climate data in adaptation efforts for the Canadian transportation sector.

Overview

Transportation authorities across Canada are grappling with the impacts of climate change, including more frequent and more intense precipitation events, extremes in temperatures, and variable freeze-thaw cycles, all of which require climate-smart decision-making to adapt. To learn more about how facets of our climate system impact the transportation systems you use everyday, explore this section.

Read further

Case Studies

Assessing Highway Vulnerabilities with the PIEVC Protocol

Across Canada, engineers who design public infrastructure realised that their projects were vulnerable to climate change and in response they developed the PIEVC Protocol to address the impacts of climate variability and change for their transportation infrastructure projects. This case study shares how it was applied in BC.

Metrolinx: Mainstreaming Climate Risk Assessment

The implementation of the PIEVC Protocol across Metrolinx, Canada’s largest transit authority, supported the development of an organization-wide adaptation strategy and a commitment to the ongoing understanding of climate change impacts of specific interest to the organization.

Pavement and Extreme Temperatures in the City of Toronto

Increasing maximum daily temperatures can have negative impacts on roadway pavements. In response to the potential costs and mobility delays caused by premature pavement deterioration, proactive increases to pavement performance grades have been implemented in the City of Toronto.

Winter Ice Roads in Northern Ontario

Winter ice roads represent a critical means of access for remote northern communities, and a warming climate has already negatively impacted ice road season length. This case study explores the use of a climate threshold as one indicator of the viability of winter roads into the future.

Blog Posts

February 5, 2024
New and Noteworthy: Podcast pilot launch

Rachel Malena-Chan, Canadian Centre for Climate Services

Topics

Adaptation, New and Noteworthy, Training, Transportation

Read more
July 19, 2022
Using Climate Data to Assess Risks in the Transportation Sector

Ryan Smith and Maginda Magendrathajan, Canadian Centre for Climate Services

Topics

Adaptation, Transportation

Read more
July 12, 2022
Roads of the Future: How Climate Data can be Used to Adapt Our Roads to a Changing Climate

Stacey O’Sullivan and Kari Tyler, Pacific Climate Impacts Consortium

Topics

Transportation

Read more

Sector Resources

Climate Change Thresholds in the Transportation Sector

While using the Analyze page to download a custom selection of climate data is simple, finding out what climate threshold value(s) you should use may not be. Information on what thresholds to use in your specific context may be available from relevant transportation authorities, provincial guidelines, or academic research.

IDF Curves and Climate Change

Learn how to use, read and interpret IDF curves, as well as how to account for extreme precipitation in a changing climate.

Analyze Page

For indices not included in the pre-calculated variable list, the Analyze page can be used to create custom indices, such as Days with a Freeze-Thaw cycle.

Learning Zone

Further information on using climate data or selecting a relevant historical dataset can be found in the Learning Zone.

Stakeholder Engagement Methods

Through a bilingual survey, transportation stakeholders were consulted on the most useful climate information, indices, impacts, and learning resources for their transport-climate decisions. Here you can learn more about stakeholder feedback regarding what climate information is most needed to inform climate-smart decisions in the transportation sector.

Related Variables

Explore variables to learn about how data was used to impact climate related decisions in specific contexts.

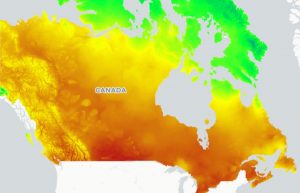
The Hottest Day describes the warmest daytime temperature in the selected time period. In general, the hottest day of the year occurs during the summer months.

High temperatures are important. They determine if plants and animals can thrive, they limit or enable outdoor activities, define how we design our buildings and vehicles, and shape our transportation and energy use. However, when temperatures are very hot, people – especially the elderly – are much more likely to suffer from heat exhaustion and heat stroke. Many outdoor activities become dangerous or impossible in very high temperatures.

Technical Description:

The highest maximum temperature (Tmax) in the selected time period. Use the Variable menu option to view annual, monthly or seasonal values for this index.


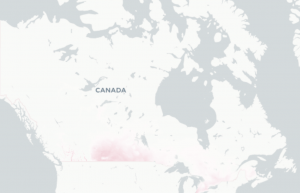
Days with Tmax > 32°C describes the number of days where the daytime high temperature is warmer than 32°C. This index gives an indication of number of very hot days in the selected time period.

High temperatures are important. They determine if plants and animals can thrive, they limit or enable outdoor activities, define how we design our buildings and vehicles, and shape our transportation and energy use. However, when temperatures are very hot, people – especially the elderly – are much more likely to suffer from heat exhaustion and heat stroke. Many outdoor activities become dangerous or impossible in very high temperatures.

Technical description:

The number of days with a maximum temperature (Tmax) greater than 32°C. Use the Variable menu option to view annual, monthly or seasonal values for this index.


Maximum 1-Day Total Precipitation describes the largest amount of precipitation (rain and snow combined) that falls within a single 24-hour day for the selected time period. This index is commonly referred to as the wettest day of the year.

Very high 1-day precipitation totals could be the result of intense, but short-lived precipitation events such as thunderstorms, or may be due to precipitation occurring steadily over the course of the day. Short duration, high intensity precipitation events may lead to flash flooding, particularly in urban areas where storm drains may be overwhelmed. Heavy snowfall events can cause damage to buildings and disrupt transportation services.

Technical description:

The largest precipitation total that falls in a single day in the selected time period. Use the Variable menu option to view annual, monthly or seasonal values for this index.