In this series, we take a deep dive into the many climate change maps available on ClimateData.ca. This month, we are focusing on maps showing projected changes in the number of days per year with total precipitation (combined rain and snow) amounts greater than 10 mm. The number of these “wet days” is an important threshold, as we will discuss below.
Why Wet Days Matter
Adequate precipitation is crucial to water availability, agriculture, electricity generation, and wildfire suppression. For Canadians, a map displaying the number of wet days, where precipitation exceeds 10 mm of rain and snow combined, can be particularly informative. It assists in agricultural planning by indicating likely irrigation needs, urban planning in areas that are prone to pluvial flooding, and the design of critical infrastructure like culverts and storm drains.
Deciphering the Map’s Message
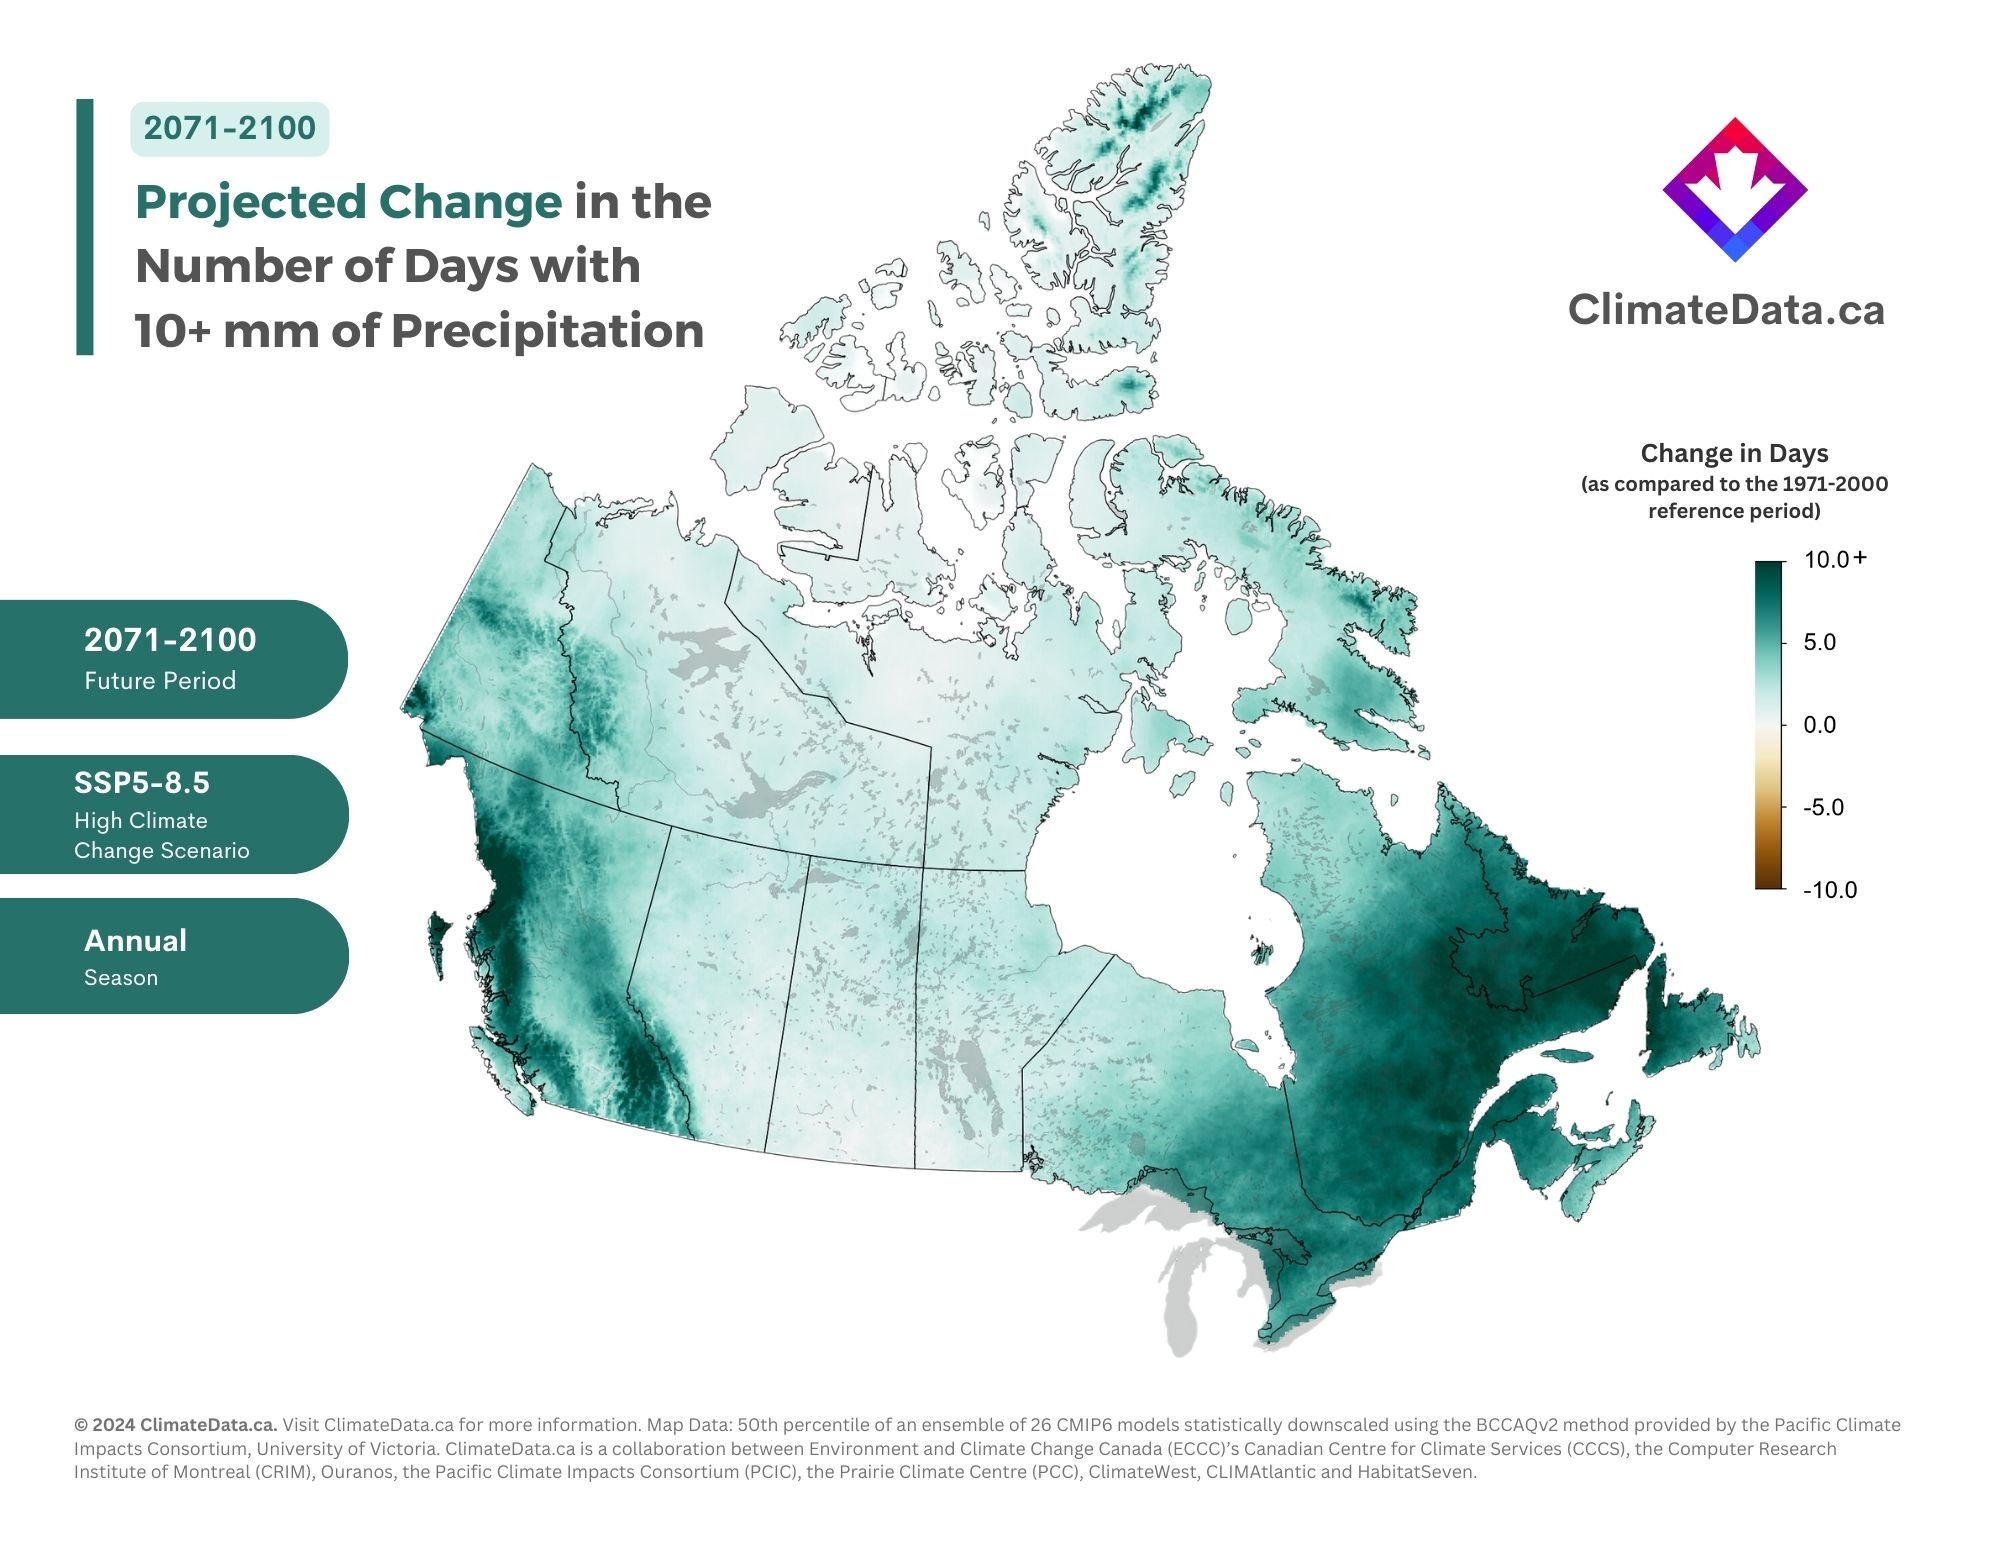
We call the map below a delta map. It shows the change in the number of days with 10+ mm of precipitation between the historical baseline (1971-2000) and the projected future (2071-2100) under SSP5-8.5, the highest climate change scenario on ClimateData.ca. To learn more about the importance of using 30-year time periods when examining changes in climate, visit our learning zone article on the subject.
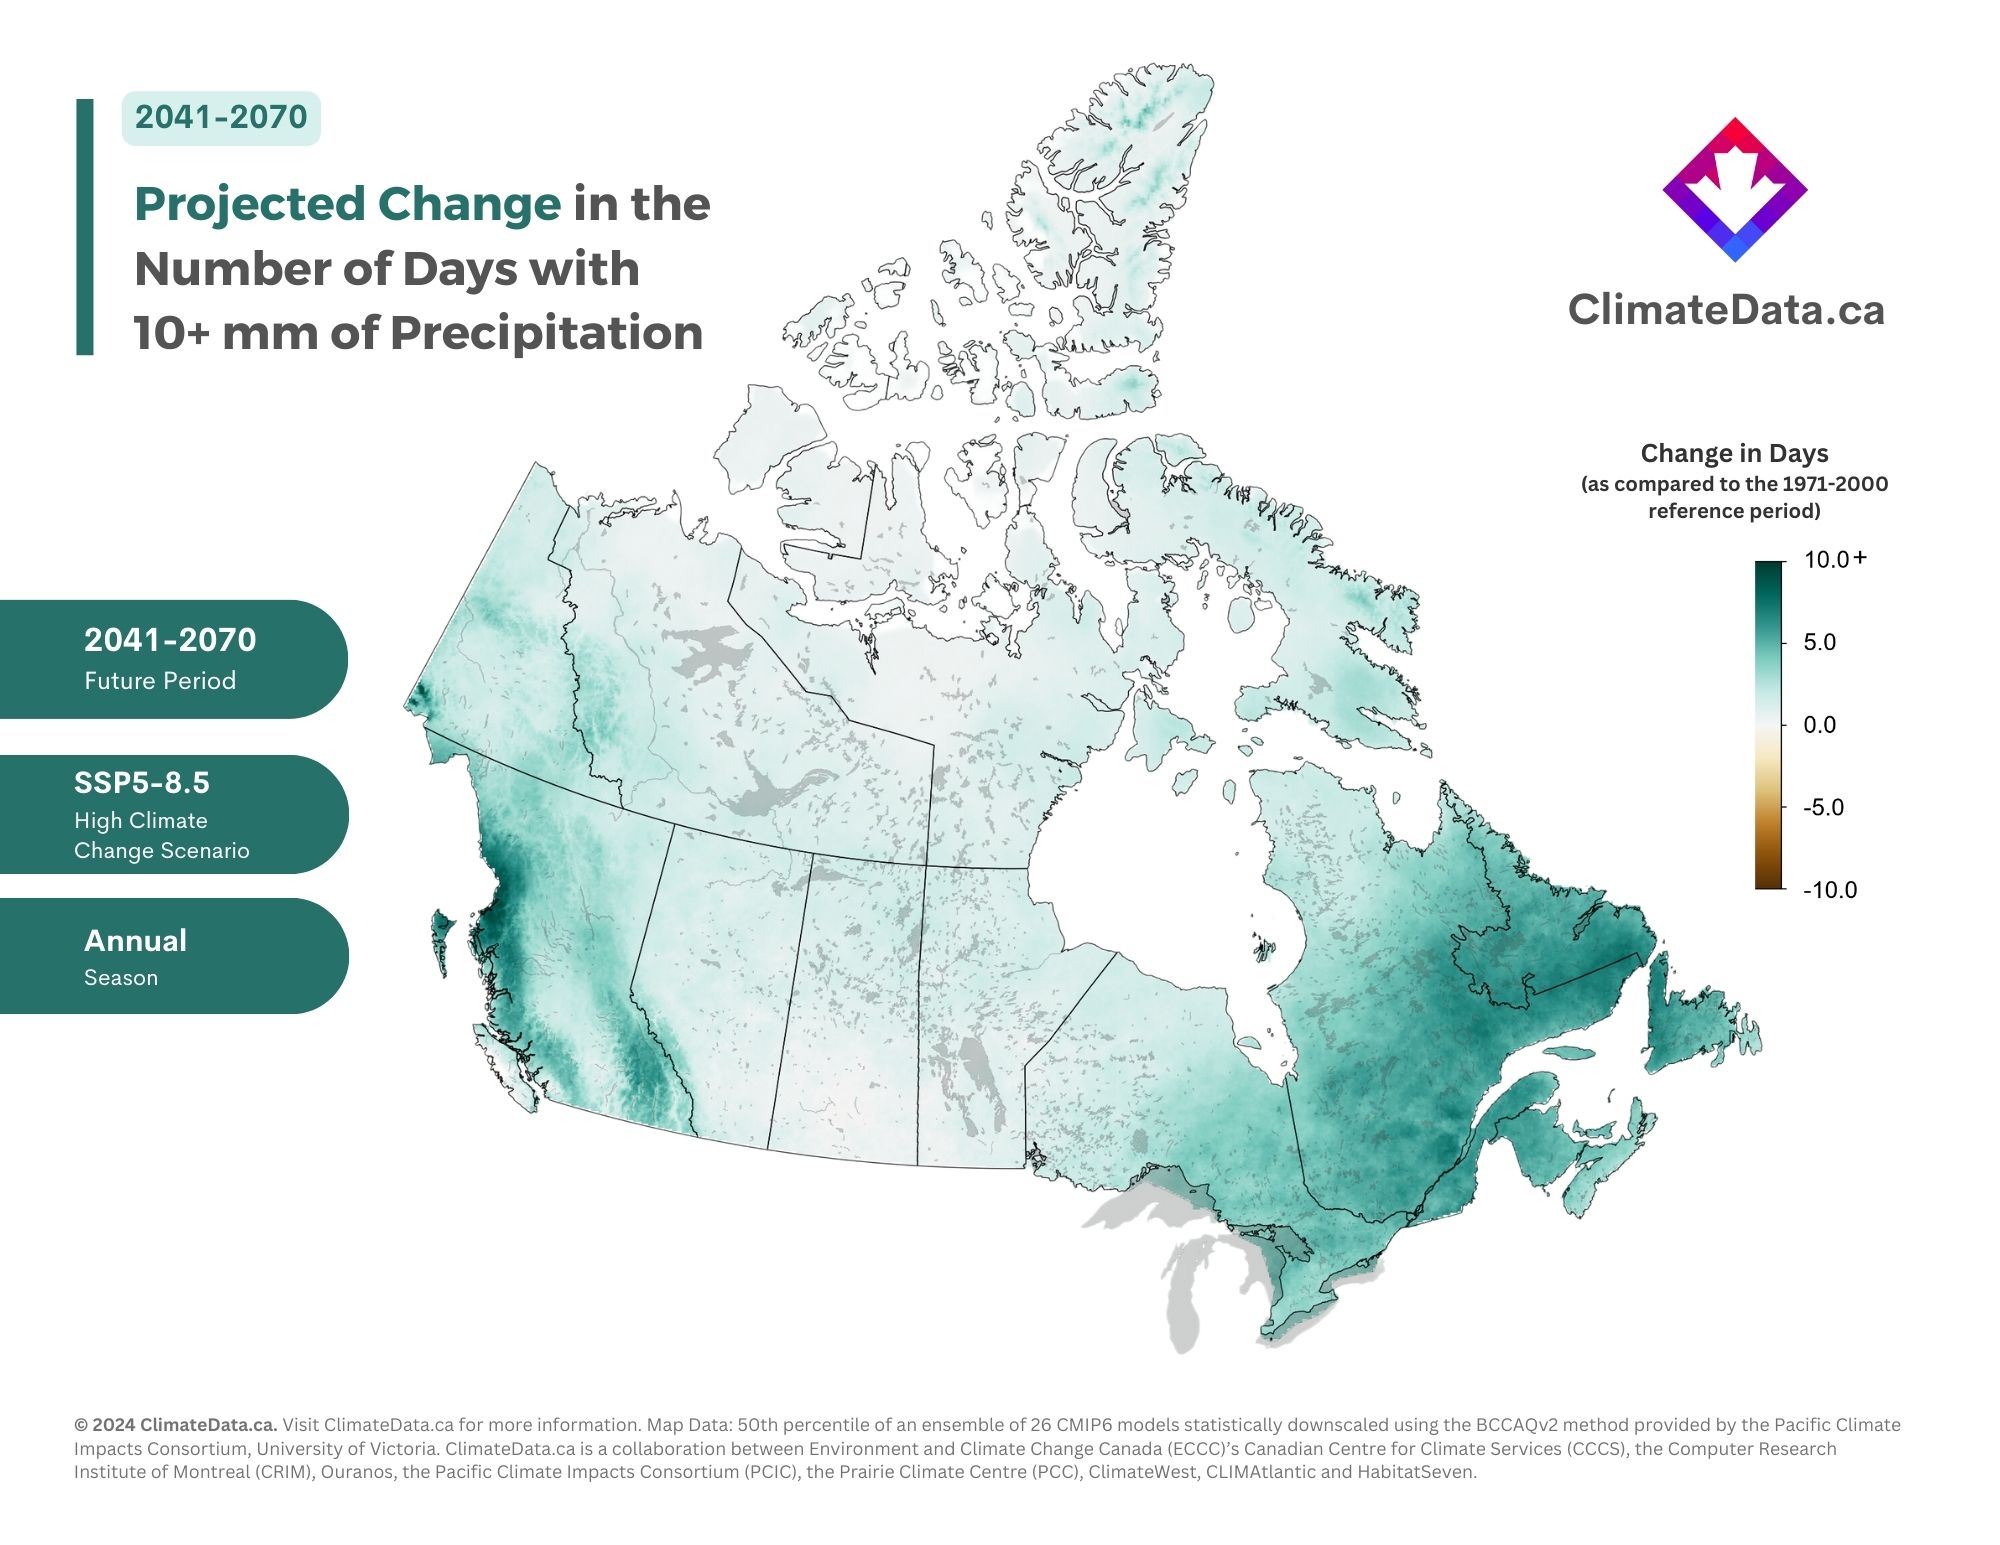
The second map is like the first one but shows the change in 10+ mm days between the baseline period and the 2041-2070 future period, also under the SSP5-8.5 scenario.
Map Insights
These maps reveal that wet weather patterns are likely to change as the planet warms. The darker green shades indicate regions where the frequency of wet days is expected to increase, most notably in parts of British Columbia and eastern Canada. Conversely, lighter shades suggest very little to no change, particularly evident in central Canada. Referring to the map we shared last month, which highlights the number of days per year with temperatures reaching or exceeding 30°C, it is noteworthy that central Canada is expected to experience a substantial increase in hot days. Coupled with a minimal rise in wet days, these projections raise concerns about the potential for drought-related climate impacts in the region.
This information is crucial for adapting water resource management, agriculture, and disaster mitigation strategies in response to changing precipitation patterns.
Important map caveats
On ClimateData.ca, SSP5-8.5 is the scenario with the highest amount of climate change by end of century. Not shown here are the SSP2-4.5 and SSP1-2.6 scenarios. SSP2-4.5 is a “moderate” emissions scenario. SSP1-2.6 is the lowest emission scenario on ClimateData.ca. To learn more about emission scenarios, please visit our learning zone article on the topic. Importantly, these maps illustrate the “median” number of wet days, computed from an ensemble of 26 global climate models. The ensemble range indicates substantial variability in yearly wet day values, meaning, much like the present-day climate, some years will have many more 10+ mm days than others. It is important to acknowledge variability, so that adaptation plans consider the full range of potential values. Learn more about climate model ensemble in our learning zone article on the topic.
Browse more maps and data
To browse more maps on ClimateData.ca, including projected 10+ mm days under different time periods and scenarios, please visit our interactive map page.