Map of the Month
In this series, we take a deep dive into the many climate change maps available on ClimateData.ca. This month, we are focusing on maps showing projected changes in the number of “ice days” per year, or days with a maximum temperature below 0 °C. The number of ice days is an important threshold, as we will discuss below.
Why Ice Days Matter
Ice Days describe the number of days where the warmest temperature of the day is below 0°C. In other words, this index indicates the number of days when temperatures have remained below freezing for the entire 24-hour period. This index is an indicator of the length and severity of the winter season.
Cold weather is an important aspect of life in Canada. Many places in Canada are well adapted to very cold winters. Cold temperatures affect our health and safety, determine what plants and animals can live in an area, limit or enable outdoor activities, define how we design our buildings and vehicles, and shape our transportation and energy use.
Deciphering the Map’s Message
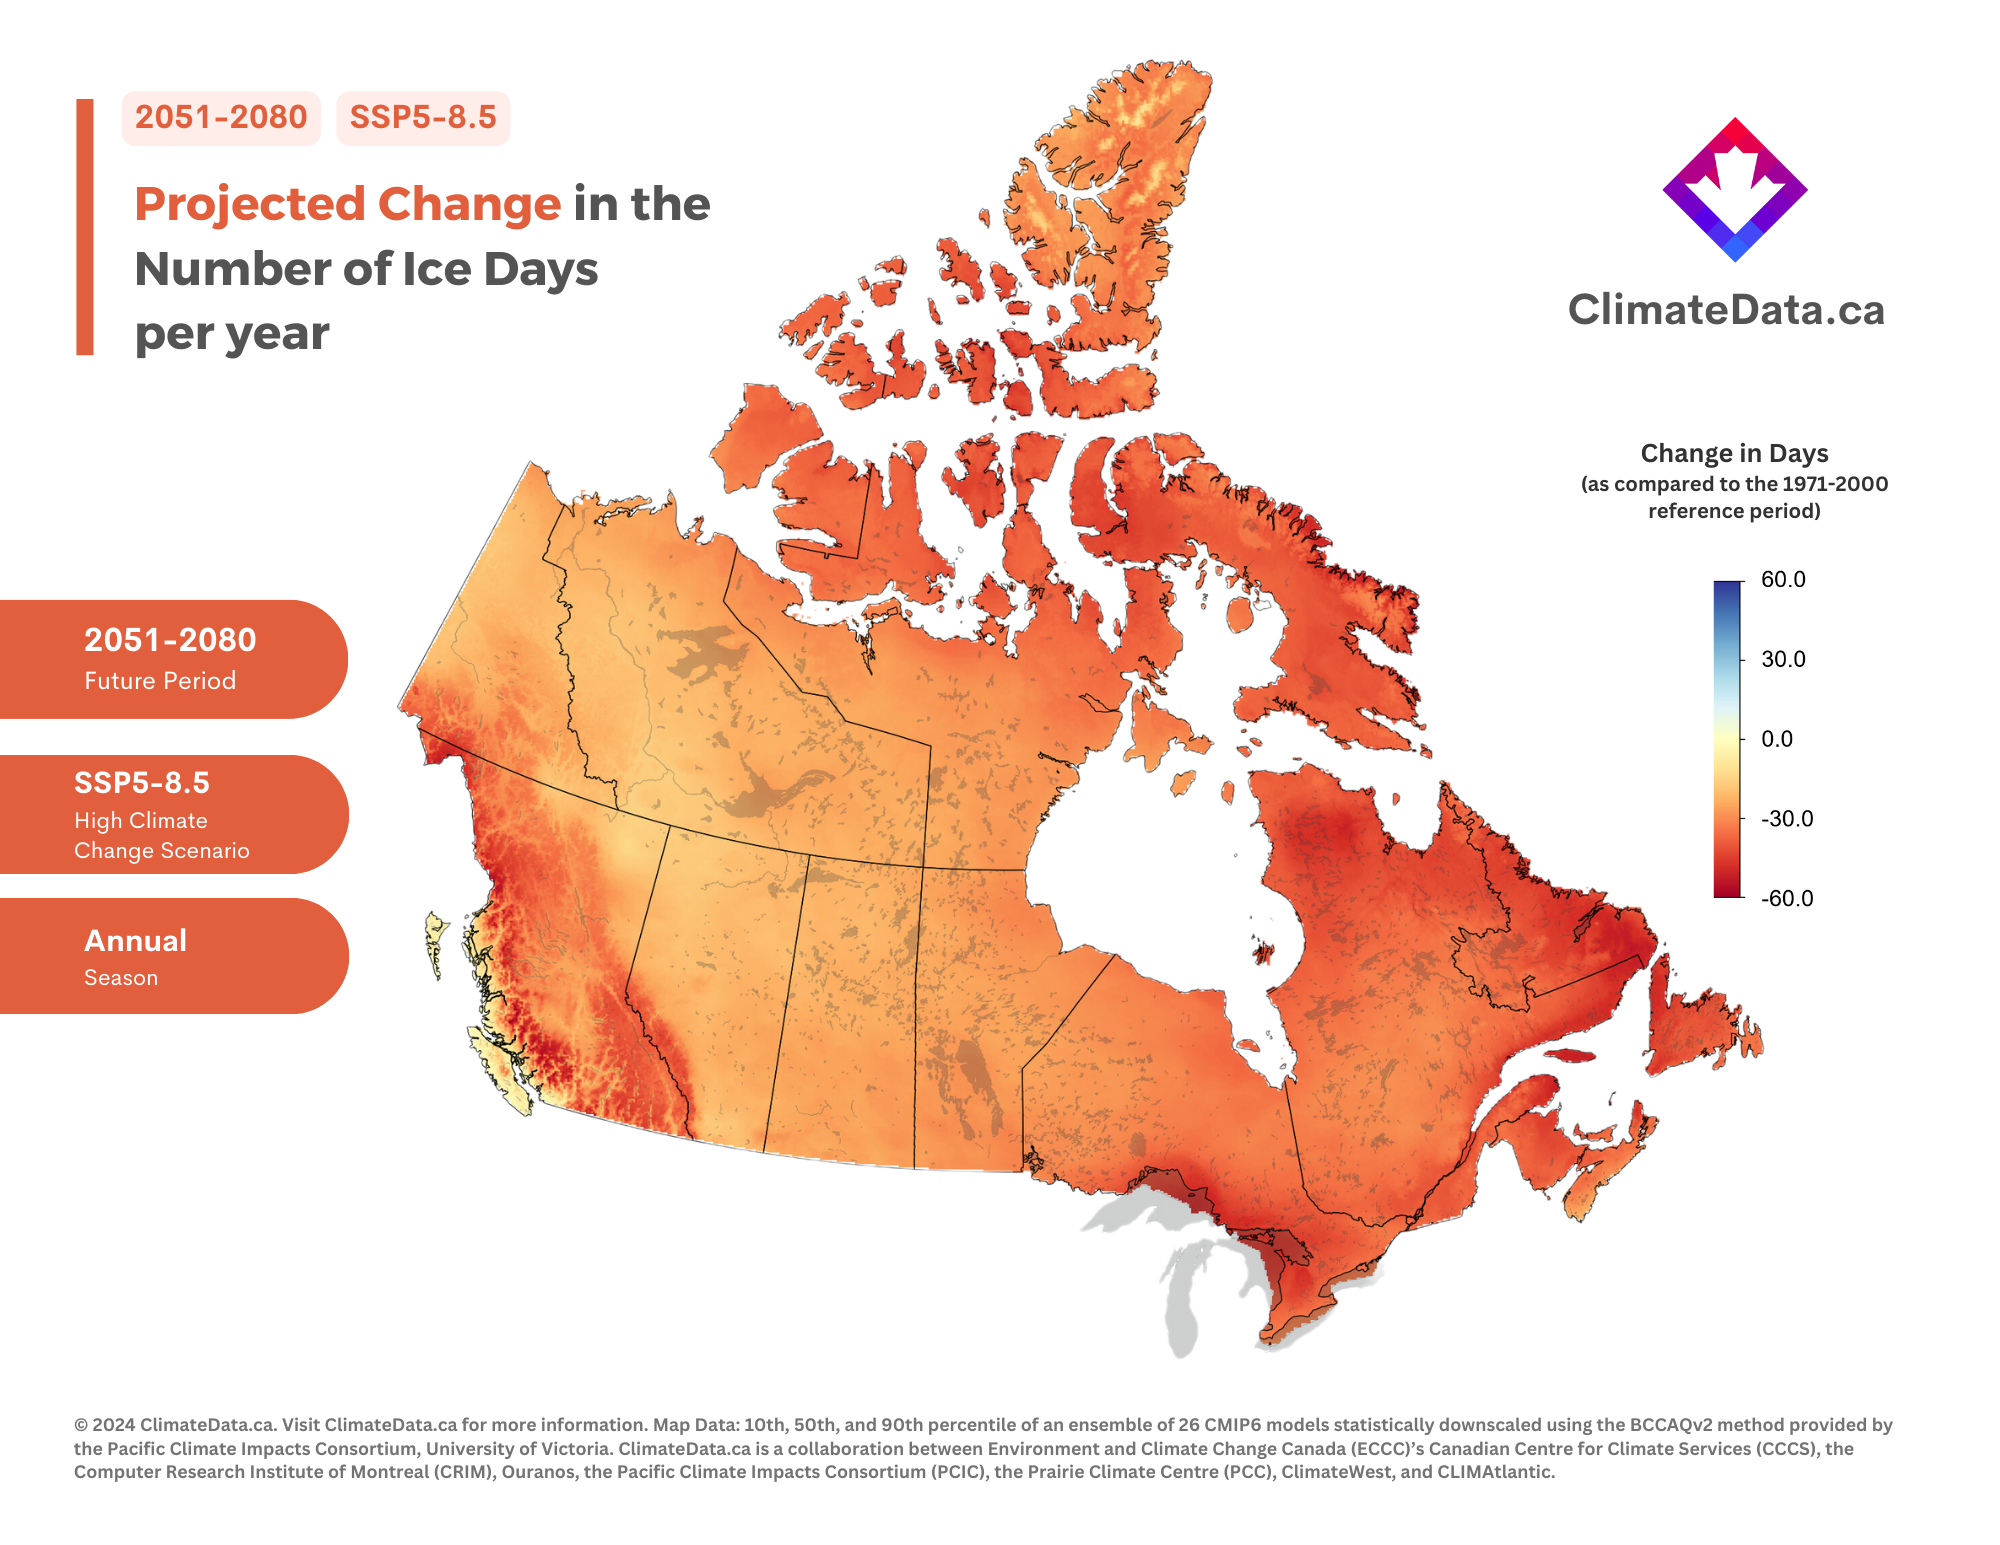
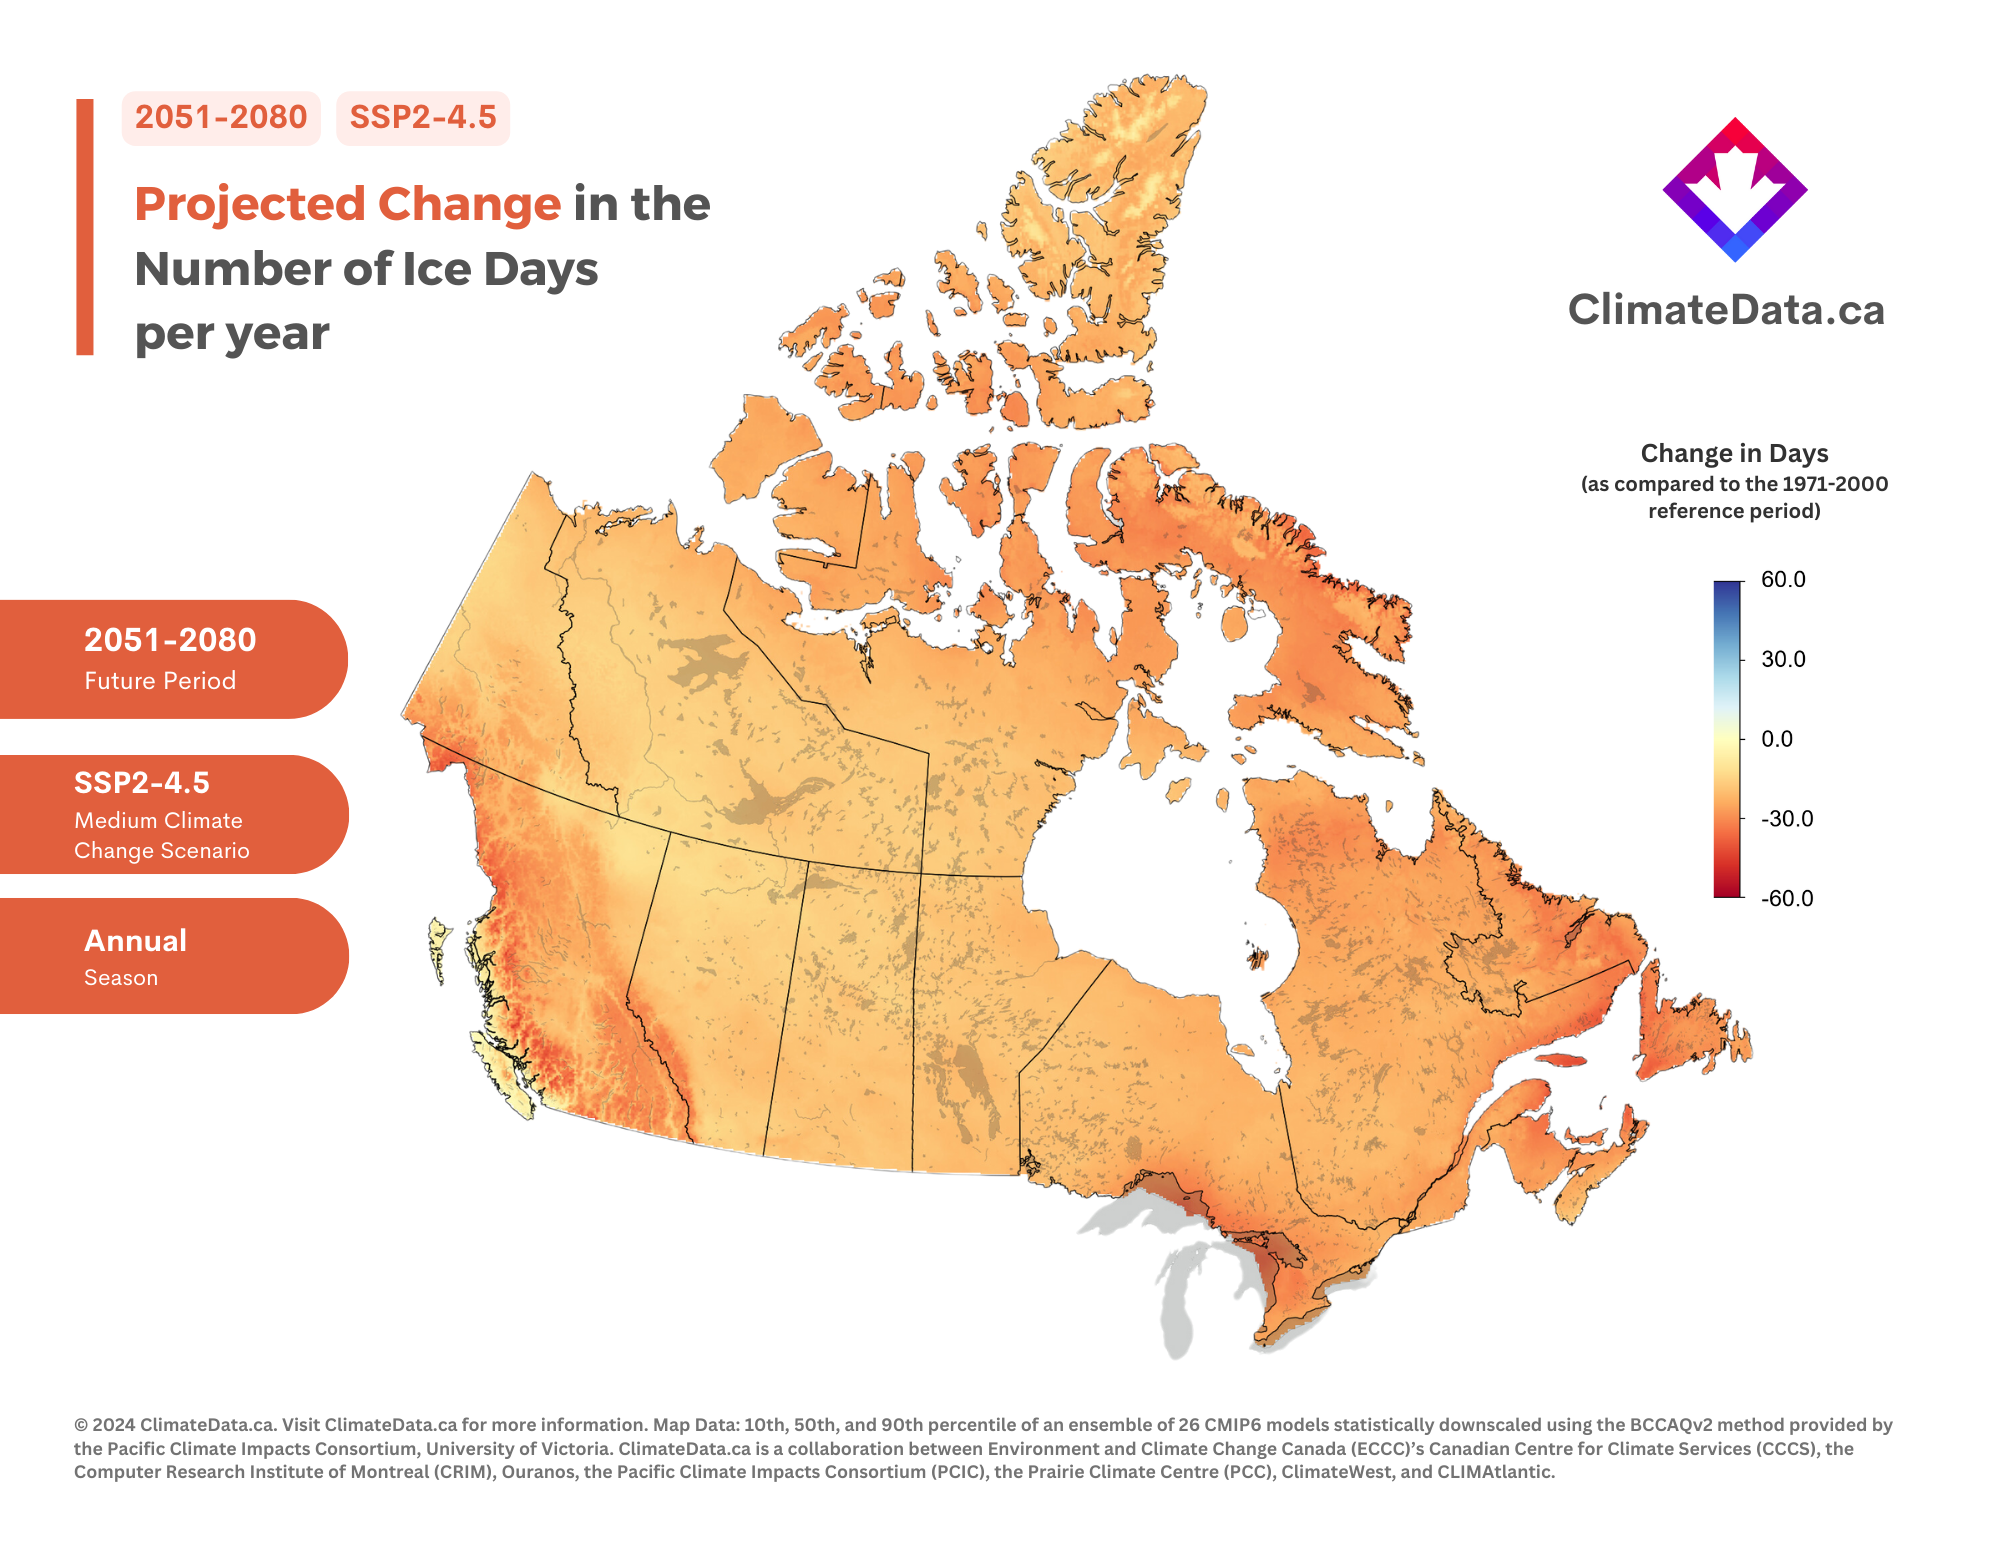
We call the maps below delta maps. They show the change in the average number of ice days per year between the historical baseline (1971-2000) and the projected future (2051-2080) under SSP5-8.5, the climate change scenario resulting in the most warming on ClimateData.ca, as well as SSP2-4.5, a “medium” climate change scenario. To learn more about climate change scenarios, visit our learning zone article on the subject.
Map Insights
These maps illustrate the projected reductions in the number of ice days across Canada under both the SSP5-8.5 and SSP2-4.5 scenarios. These projections underscore the importance of considering the impacts of climate change on activities, assets, and natural systems that are dependent on prolonged periods of freezing temperatures. For instance, as illustrated by the impact on outdoor skating rinks in Canada, warming winters have already shortened skating seasons, with iconic locations like Ottawa’s Rideau Canal experiencing a decline of nearly 7 days per decade in outdoor skating days since the 1970s. The shrinking season on the Rideau Canal—culminating in its unprecedented closure for the entire 2022-2023 winter—exemplifies how diminishing cold days can disrupt not only recreational activities but also community traditions and economic sectors tied to extreme cold conditions. This shift also calls for a reassessment of infrastructure planning, particularly in sectors sensitive to the changing cold climate.
Important map caveats
On ClimateData.ca, SSP5-8.5 is the scenario with the highest amount of climate change by end of century. Likewise, SSP2-4.5 is a “moderate” emissions scenario. Not shown here is SSP1-2.6 scenario. SSP1-2.6 is the lowest emission scenario on ClimateData.ca. To learn more about emission scenarios, please visit our learning zone article on the topic.
Browse more maps and data
To browse more maps on ClimateData.ca, including projected changes in ice days under different time periods and scenarios, please visit our interactive map page.


