All Variables

Below is a library of all variables available within ClimateData.ca. Use the filter to limit your search to specific types of data.

Key Messages

  • Historical Intensity-Duration-Frequency (IDF) curves are graphical tools that describe the likelihood of a range of extreme rainfall events. Environment and Climate Change Canada (ECCC) produces IDF curves using statistical techniques and records of past rainfall.
  • IDF curves are used by a wide range of professionals – including engineers, water resource managers, and urban and regional planners – to manage impacts and risks related to extreme rainfall.
  • Practitioners should understand how to use, read and interpret IDF curves before using them for decision-making.  They should also be aware of key challenges and limitations in measuring extreme rainfall and creating IDF curves, in order to avoid misuse.
  • Historical IDF curves alone cannot be used to assess future extreme rainfall conditions, which are expected to shift significantly over time due to climate change. Methods exist to scale historical IDF data to account for climate change. Climate change-scaled IDF data is provided on ClimateData.ca, as a station data variable.

What are IDF Curves?

Intense precipitation events can deliver large amounts of rain over short periods of time. This rain, as well as related flooding, can overwhelm storm drains, flood basements, wash out bridges and roads, and trigger landslides. To reduce the risk of these impacts, engineers, hydrologists, planners and other decision makers rely on accurate information about extreme rainfall events. IDF curves are one important source of this information.

Three main elements are described in IDF curves:

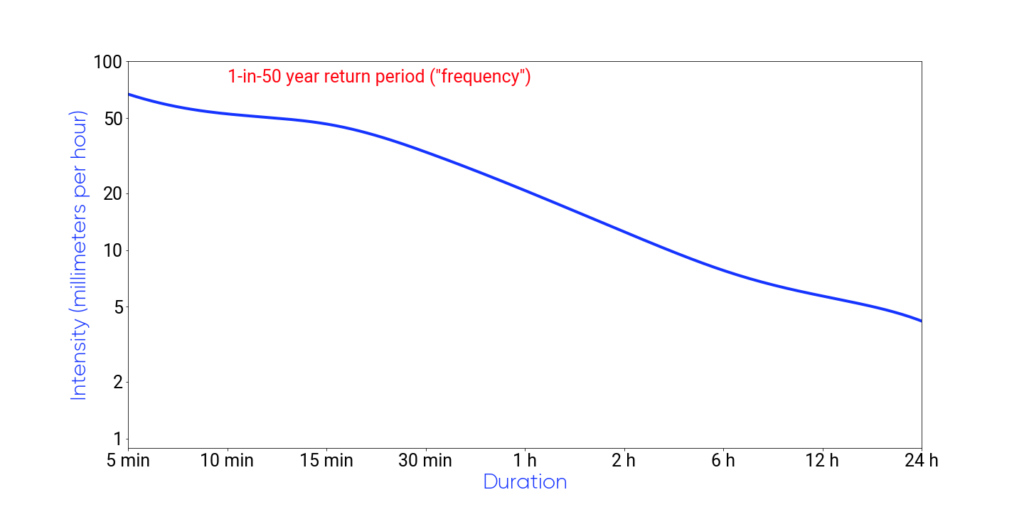
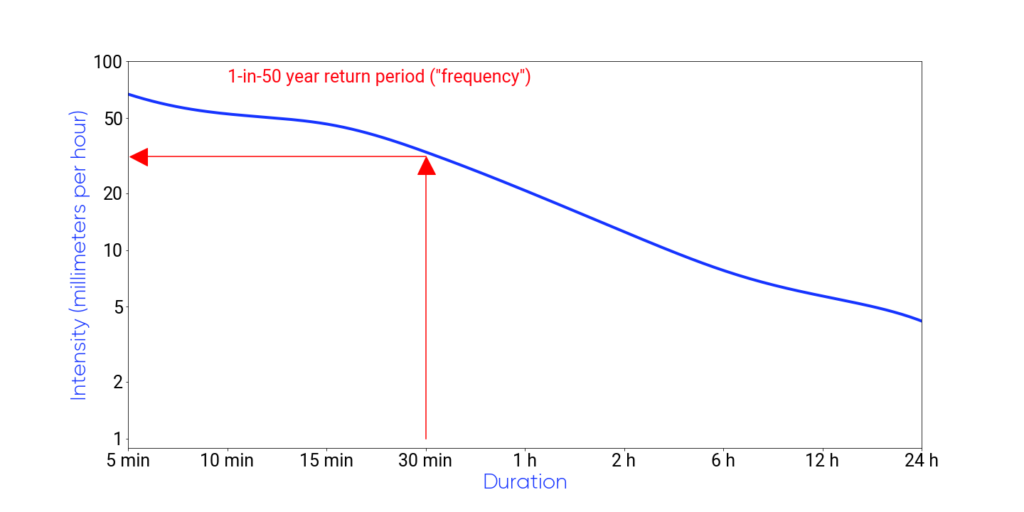
Duration: The period of time of interest. Typical IDF curves include extreme precipitation durations ranging from 5 minutes to 24 hours.

Intensity: The average rainfall rate over the specific duration of interest, in units such as mm/h.

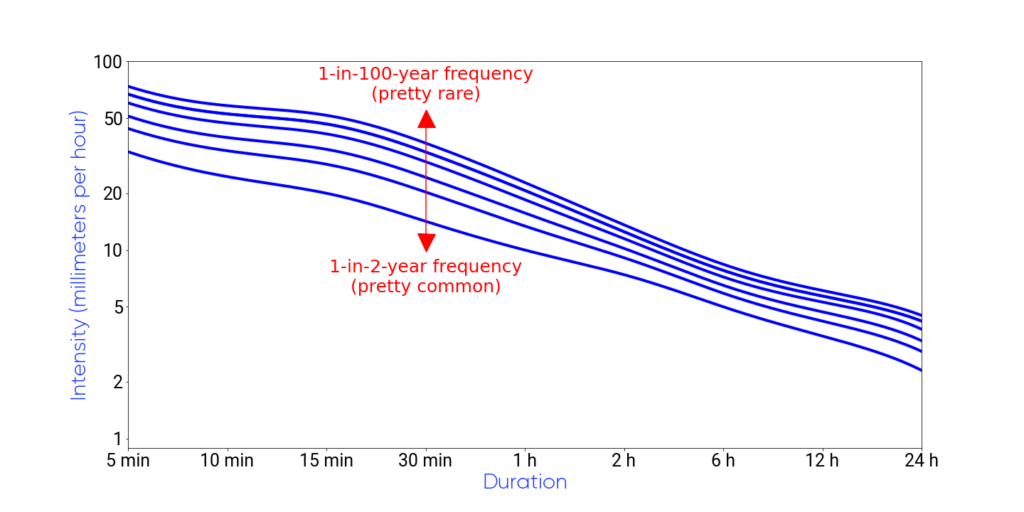
Frequency: To plan for extreme events of a specified duration and intensity, it matters how often such events occur.

This is often described as a return period, which is defined as how often, on average, the event is expected to occur. Frequency can also be thought of in terms of probability or likelihood. For example, an event with a 1-in-20 year return period will occur on average once every 20 years, and therefore has a 1-in-20, or 5%, chance of occurring each year.

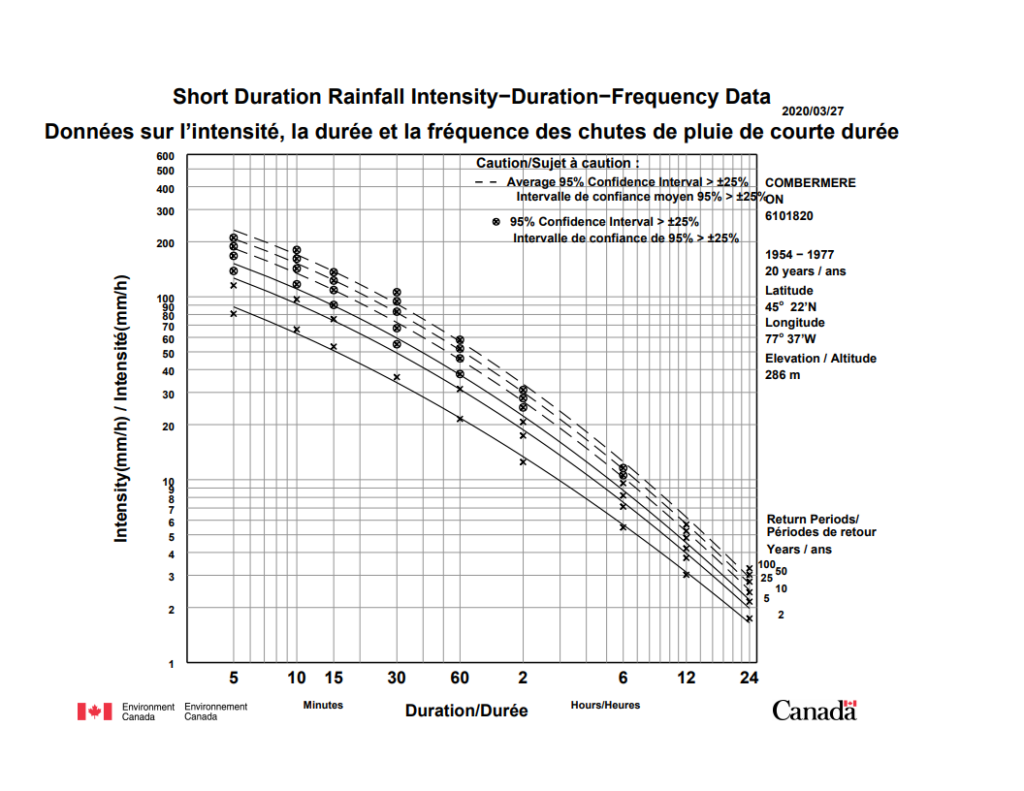
To use IDF curves, users can choose the rainfall duration (horizontal axis) and return period of interest (different lines) for their application, to determine the relevant rainfall intensity (vertical axis).

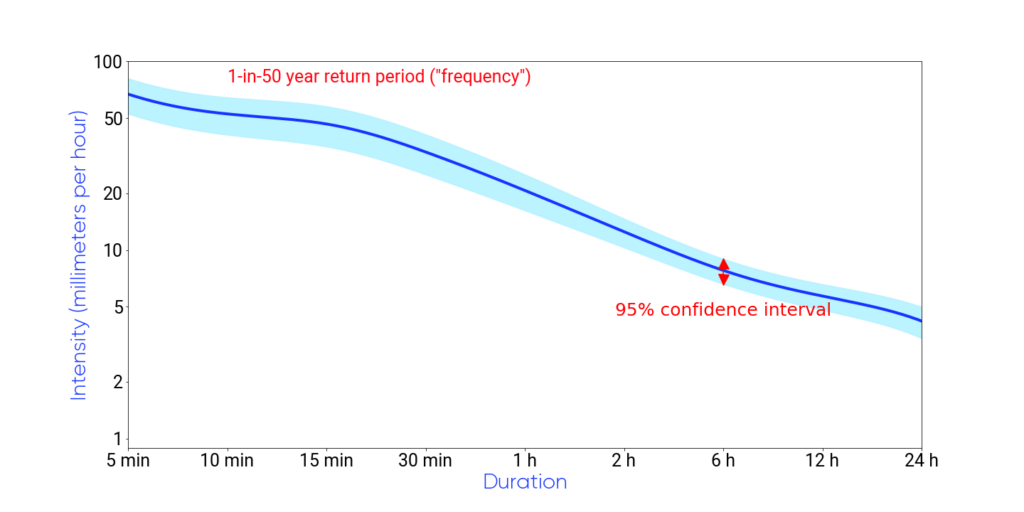
To help understand where data is most reliable, some IDF curves contain additional information known as confidence intervals, which describe the uncertainty in the IDF values that may arise from statistical chance. Simply put, users can trust that rainfall intensity values for a given duration and return period are likely to fall within the confidence interval that brackets the central IDF curve line.

Consider a 10 mm/hr rainfall intensity central value that is bracketed by a 95% confidence interval at 5 mm/hr and 15 mm/hr. This means that 95% of the time (19 times out of 20), the ‘real’ value of rainfall intensity for this duration/return period will fall between 5 and 15 mm – and, conversely, that there is only a 5% chance that the value will fall outside this range due to particularly abnormal storms or weather patterns.

It is important to note that this measure is a statistical one only and does not account for factors that have the potential to affect the IDF values such as decadal instrument errors, changes to station locations, climate variability, or long-term climate change. Other measures are taken to address each of these potential sources of uncertainty such as adjustment and homogenization of stations, using long time periods to derive IDF curves, and computing future projections of IDF curves.

ECCC IDF curves represent confidence intervals in a very specific way.  Solid lines/crosses indicate that the 95% confidence interval for the curve/point in question is narrow – less than 25% of the central rainfall intensity value (in other words, uncertainty in the value is relatively low).

Conversely, dashed lines/circled crosses indicate curves/points where the 95% confidence interval is wide – more than 25% of the actual rainfall intensity value.  In this situation (which occurs more often for shorter durations, and longer return periods), the central value of rainfall intensity should be treated with relatively more caution.

How are IDF Curves produced?

IDF curves are produced using rainfall data that is collected by the Meteorological Service of Canada, ECCC. First, rainfall data is obtained from a weather station that is part of the national network operated by ECCC and housed in the National Climate Archive.

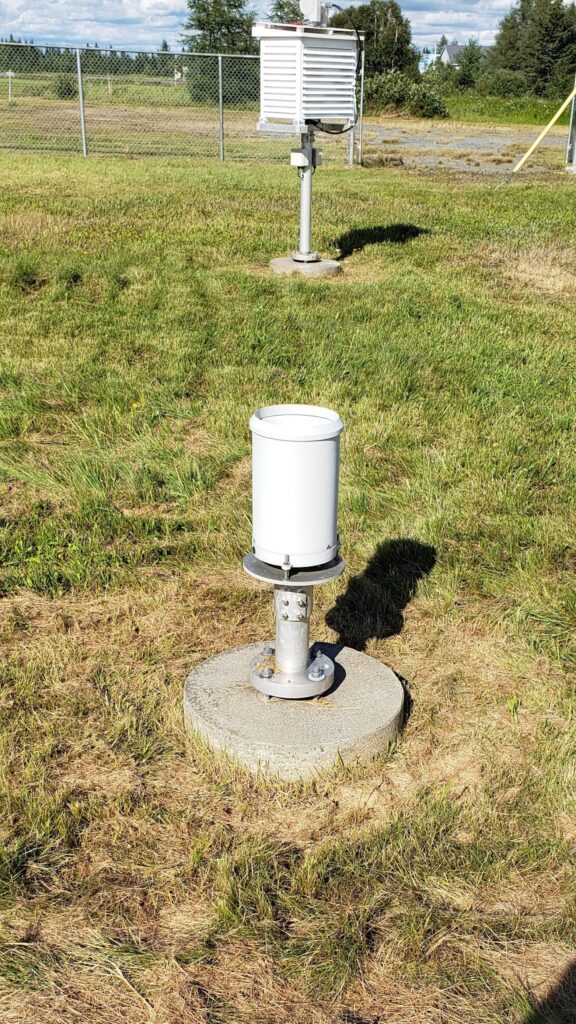
To record rainfall data, a weather station must be equipped with a tipping bucket rain gauge (TBRG) that can record rainfall amounts for periods as short as 5 minutes. This data is then carefully reviewed to ensure that, for example, it is not influenced by equipment malfunction, and that the data captures extreme rainfall events that is consistent with other station, radar and satellite data.

After the initial quality control work has been performed, the next step is to find the maximum rainfall amounts for each duration, and for each year. These values are referred to the as annual maximum series (AMS) of rainfall.  In the case of IDF curves provided by ECCC, IDF curves are only produced for stations that, after all review and data quality control is complete, have an AMS of rainfall that contain annual maximum values for 10 or more years (to learn more about this process visit the Engineering Climate Datasets).

In order to calculate extreme values for specific return periods, the AMS is fitted to the Gumbel extreme value distribution using the method of moments. In simple terms, this is just a statistical method to estimate extreme return period values from limited observational data.

Return period estimates correspond to rainfall event probabilities at a single location: the weather station at which the rain measurements were taken. They do not reflect rainfall amounts or rates over wider areas. Since IDF curves are based on the analysis of historical rate-of-rainfall data, they do not explicitly incorporate any projected future changes due to a changing climate.

Similarly, because of climate change, IDF curves based on very old historical data may not be valid for the present day. Finally, the term ‘return period’ should not be taken to imply that these extreme events recur on a regular, steady cycle. For example, the term ‘1-in-25 year’ rainfall does not imply that a rainfall of this magnitude occurs regularly every 25 years. Instead, it means that a rainfall event of this magnitude has a 1-in-25 (4%) chance of occurring in any given year. Indeed, it is possible to have 1-in-25 year events in consecutive years, or, not at all for 30 years.

Now that you have completed reading IDF Curves 101, you may be interested in Best Practices for Using IDF Curves.

For more information on the impacts of climate change in Canada, see Canada’s Changing Climate Report.

For any questions about using climate data and information, please contact the Climate Services Support Desk.