Last update: August 2026
NOTE: The information on this page is neither prescriptive nor exhaustive. Content is updated periodically as more information becomes accessible. Readers are encouraged to consider complementary information.
Explore climate indicators and data resources relevant to drought in Canada.
Climate Hazards
Article
15 minutes
Last update: August 2026
NOTE: The information on this page is neither prescriptive nor exhaustive. Content is updated periodically as more information becomes accessible. Readers are encouraged to consider complementary information.
Drought is a compound hazard, meaning that multiple climate conditions contribute to its occurrence. To better understand drought, this table can be considered with the tables on Extreme heat and heatwaves and Wildfire and fire weather.
This table connects a climate-related hazard with readily available and relevant climate variables and indicators. Knowledge of regional characteristics is key for interpreting and using climate information in local planning. Where possible, project context, local knowledge, traditional knowledge, and/or additional assessments or studies can inform indicator selection and interpretation, to support the link from data to decision-making. Visit the Climate Hazards module to see the full list of hazard tables available, and to view the methodology and inclusion criteria for the tables.
| Future changes | Relevant climate variables and indicators | Climate Data Sources* |
|---|---|---|
| Changing total precipitation, with changes varying by region and season. | Total precipitation: Total amount of precipitation (in mm) accumulated. | National
Regional
|
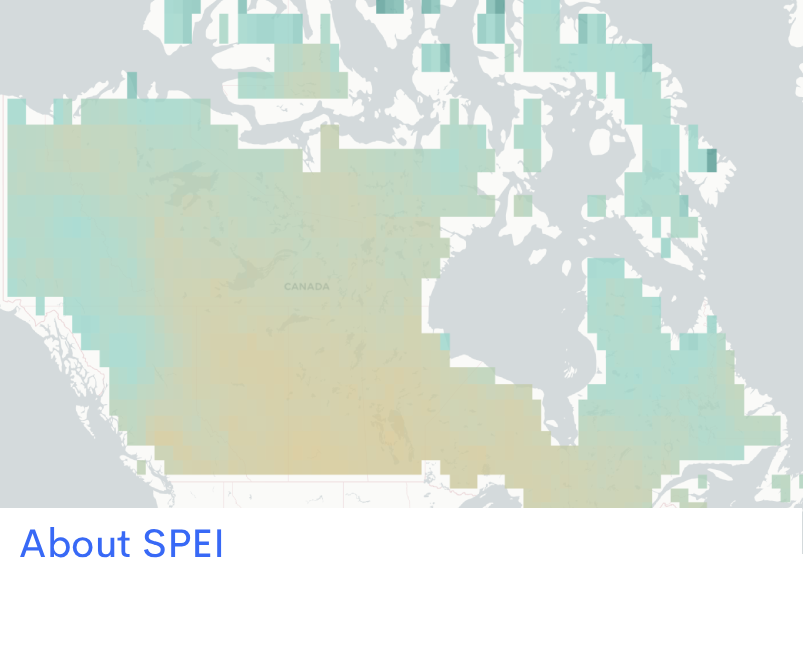
| Increasing severity of drought conditions in some areas and seasons. | Standardized Precipitation Evapotranspiration Index (SPEI): A unitless meteorological drought index that provides a relative measure of surface water availability compared to historical conditions. | National Analytical
|
| Drought varies by region and season. | Standardized Soil Moisture Index (SSI): A unitless agricultural drought index that provides a relative measure of surface (10 cm) soil moisture. | Analytical
|
| Soil Moisture Index (SMI): A unitless indicator that provides a measure of soil moisture changes within the rooting zone of trees. | National
| |
| Standardized Runoff Index (SRI): A unitless hydrological drought index that provides a relative measure of surface runoff. | Analytical
| |
| Climate Moisture Index (CMI): A drought index calculated as the difference between annual precipitation and potential evapotranspiration. | National
Analytical
| |
| Palmer Drought Severity Index (PDSI): A drought index based on precipitation, temperature, moisture-holding capacity of the soil, and local infiltration. | National
| |
| Drought varies by region and season. | Canadian Drought Outlook and Monitor: These maps use a “convergence of evidence” approach, pulling together satellite data, observations, model data and subject matter expert interpretation. | National
|
| Increasing frequency of droughts in some regions. | Return levels and return periods of extreme droughts: 1-in-10-year warm season (April–September) drought occurrences. | See static maps in Figure 5.18 Projected changes in once-in-a-decade warm-season occurrences of meteorological, agricultural, and hydrological droughts in CCCR2026 Chapter 5: Changes in the water cycle. |
| Increasing frequency and duration of dry spells. | Dry spells
| National
Regional
Analytical
|
| More dry days. | Dry days: Number of days without rain or snow. | National
Regional
|
| Decreasing snowpack in most locations, but with considerable variation by region. |
| Snow can be measured in several ways, including total snowfall, snow depth, and snow water equivalent. While the indicators below do not directly measure snowpack, they can help indicate future changes. National
Analytical
Regional
|
* Additional advanced data analytics tools listed on the Climate Hazards page provide more complex data download options, programming environments and specialized software to support bulk downloads, custom data processing, and analysis of large Canada-wide datasets, and include additional data not listed here.




This project was undertaken with the support of: