Understanding Shared Socio-economic Pathways (SSPs)

Learn about the latest set of emissions scenarios based on Shared Socioeconomic Pathways (SSPs). Understand how SSPs differ from Representative Concentration Pathways (RCPs) and learn about key considerations when using SSPs in climate risk assessments.

Time to completion
25 min

Summary

Learn about the latest set of emissions scenarios based on Shared Socioeconomic Pathways (SSPs). Understand how SSPs differ from Representative Concentration Pathways (RCPs) and learn about key considerations when using SSPs in climate risk assessments.

Introduction

Engineers, planners, and decision-makers across the country are increasingly using climate model information to support the development of adaptation strategies to increase resilience to the heightened risks of climate change. Historical observations alone are not suitable to assess future climate-related risks. Practitioners using future climate data want to know how much the climate will change, and thus how much future climate risk they should expect to encounter in the coming decades or at the end of the century. However, how much the climate will change in the future will be determined by greenhouse gas emissions which, in turn, are strongly dependent on how society grows and develops. These growth patterns are influenced by a host of factors, including global cooperation on greenhouse gas reductions, political will, and technological advancements. Even seemingly small changes to any of these factors can result in very different outcomes. Therefore, rather than offer practitioners a single set of future climate data, it is best practice to provide a range of future climate scenarios that encompass various levels of greenhouse gas emissions. It is important to know about these scenarios – how they are defined and the key differences between them – prior to using future climate data.

Today, the scenarios used to characterize possible future development pathways for human societies are known as Shared Socioeconomic Pathways, or SSPs for short. The goal of this article is to introduce the SSPs, explain their similarities and differences compared to the previously used Representative Concentration Pathways (RCPs), and provide guidance to practitioners on considerations to keep in mind when selecting which scenarios to use.

What are Shared Socioeconomic Pathways (SSPs)?

Shared Socioeconomic Pathways are a set of narratives describing possible future development pathways for human society, particularly in relation to its use of fossil fuels and the social and economic factors which drive fossil fuel use. These pathways explore a range of technological, socioeconomic and policy futures as well as consider challenges to mitigation and adaptation.1 Five pathways have been developed by the international scientific community – sustainable development (SSP1), middle-of-the-road development (SSP2), regional rivalry (SSP3), inequality (SSP4) and fossil-fueled development (SSP5) – which allow practitioners to explore climate changes across a range of very different futures.

The five SSP pathways can be characterized in terms of the socioeconomic challenges they imply for mitigating and adapting to climate change (Figure 1). SSP1 (Sustainability) has few challenges to both mitigation and adaptation. In this pathway, policies focus on human well-being, clean energy technologies, and the preservation of the natural environment. In contrast, SSP3 (Regional Rivalry) is characterized by many challenges to both mitigation and adaptation. In this pathway, which relies heavily on fossil fuels and an increased use of coal, nationalism drives policy and focus is placed on regional and local issues rather than on global issues. The other SSPs “fill in the spectrum” of possible futures. SSP4 (Inequality), which follows a similar energy future to SSP1, is defined by many challenges to adaptation and few challenges to mitigation. SSP5 (Fossil-fueled Development), also heavily reliant on fossil fuels including coal, is characterized by many challenges to mitigation and few challenges to adaptation, while SSP2 (Middle of the Road) represents moderate challenges to both mitigation and adaptation and follows a pathway of balanced energy development.

Figure 1: The Five Shared Socioeconomic Pathways and the associated challenges to mitigation and adaptation.

The SSP narratives give a general description of the development pathways, e.g., for SSP1 (Sustainability), “the world shifts gradually, but pervasively, toward a more sustainable path, …, consumption is oriented toward low material growth and lower resource and energy intensity”1. The narratives are internally consistent in that they describe “the major socioeconomic, demographic, technological, lifestyle, policy, institutional and other trends”1 of each pathway and they underpin how this information is quantified. Each narrative is accompanied by quantitative information about the key scenario drivers such as population, economic growth and urbanization. To turn these narratives into scenarios containing quantitative projections of energy use, land use and greenhouse gas and aerosol emissions, Integrated Assessment Models (IAMs; see Box 1) are required.

Box 1: Integrated Assessment Models

Integrated Assessment Models are complex computer models which “combine different strands of knowledge to explore how human development and societal choices interact with and affect the natural world.”2 They examine the factors that influence greenhouse gas emissions, such as energy use choices, energy technology, land-use changes and societal trends, and by linking modules representing the global economy and its energy, land and climate systems, they can explore feedbacks and tradeoffs and answer “what if?” questions.

Just as there are multiple climate models, there are multiple IAMs and each one provides an alternative interpretation of the SSPs.

Within a single SSP there can be multiple emissions scenarios that lead to different levels of radiative forcing and, therefore, global-mean temperature increase (Figure 3). Each SSP includes a “marker” (or “baseline” or “reference”) scenario which is considered representative of the broader pathway conditions. This scenario describes a future development pathway in the absence of any new climate policies. These baseline scenarios provided the starting point for the development of mitigation scenarios. Different assumptions about mitigation ambitions, or constraints on radiative forcing, can lead to different levels of emissions within the same general socioeconomic narrative. For example, two scenarios, SSP1-1.9 and SSP1-2.6, both stem from SSP1 (Sustainability: Taking the Green Road), but were constrained to achieve different radiative forcing targets (1.9 Wm-2 and 2.6 Wm-2 at 2100, respectively). Using these constraints, different mitigation actions were applied to develop these two scenarios within the same SSP narrative.

SSP-based scenarios were used in the most recent set of climate model experiments, known as the Sixth Phase of the Coupled Model Intercomparison Project (CMIP6). Results from these experiments provide a foundation for the assessment of past and future climate change in the Sixth Assessment Report (AR6) of the Intergovernmental Panel on Climate Change (IPCC), just as the Representative Concentration Pathways (RCPs) were used by the CMIP5 climate models, which informed the IPCC Fifth Assessment Report (AR5). Five SSP scenarios spanning the range of plausible climate futures were prioritized for use in CMIP6 climate model experiments: SSP1-1.9 (closest to the Paris Agreement target of 1.5°C), SSP1-2.6 (a 2°C scenario approximately equal to RCP2.6), SSP2-4.5 (approximately equal to RCP4.5), SSP3-7.0 (a medium-high scenario) and SSP5-8.5 (a high scenario similar to RCP8.5).

Box 2: Understanding SSP and RCP labelling

SSP-based scenarios are labelled according to the pathway and the level of radiative forcing, e.g., “SSP5-8.5”. “SSP5” refers to the Shared Socioeconomic Pathway representing a fossil fuel intensive world, in this case dominated by mitigation challenges. Meanwhile, the “8.5” refers to the level of radiative forcing (8.5 Wm-2) resulting from the greenhouse gas emissions in this scenario at the end of the century.

For RCPs, e.g., RCP4.5, the number simply refers to the end-of-century radiative forcing level in Wm-2.

Figure 2: The sequence of information used to project future levels of climate change.
Figure 3: The SSP scenarios and their five SSP families. Shown are illustrative temperature levels relative to pre-industrial levels with historical temperatures (front band), current (2020) temperatures (small block in middle), and the branching of the respective scenarios over the 21st century along the five different socioeconomic families. The small black horizontal bars on the 2100 pillars for each SSP indicate illustrative temperature levels for the range of SSP scenarios that were available from the IAM community at the time of creating the baseline SSP scenarios. [Source: Meinshausen et al. (2020)3]

What are the differences between SSPs and RCPs?

While there are several differences between the SSPs and RCPs, the fundamental difference is related to the way in which the scenarios were developed, in particular the socioeconomic background in the scenarios.

The Representative Concentration Pathways (RCPs) were explicitly designed for use in climate models and were based on the range of radiative forcing documented in the scenarios literature at that time.4 Although the RCPs are based on internally-consistent sets of projections for greenhouse gas emissions, air pollutants and land use (which determine the amount of radiative forcing), they are not fully integrated scenarios like the SSPs. There are many different ways in which each RCP may be achieved, i.e., the socioeconomic characteristics leading to a particular level of radiative forcing are not standardized as they are in the SSPs. This makes it difficult to map societal changes like population, education, and government policies to climate targets, such as keeping global warming well below 2°C.

In addition, the emissions of the individual greenhouse gases are slightly different between the RCPs and SSPs (e.g., SSP5-8.5 has higher CO2 emissions than RCP8.5, which has higher methane emissions). This leads to slightly different radiative forcing values at the end of the century. So, while the radiative forcing levels are indicated to be equal (e.g., RCP4.5 and SSP2-4.5), they should be considered as approximate rather than exact end-of-century values. This is one reason why global average temperature changes associated with RCPs and SSPs for comparable levels of radiative forcing may be slightly different, the other being differences due to advances in climate modelling between CMIP5 and CMIP6.

Finally, the development of the SSPs provided an opportunity to revisit the radiative forcing levels associated with the RCPs. Two additional emissions scenarios were identified as priorities by the IPCC5 – SSP1-1.9 and SSP3-7.0.  SSP1-1.9 is an additional strong mitigation scenario which is in line with the 1.5°C goal of the 2015 Paris Agreement. SSP3-7.0 was added to fill a gap in the RCPs, namely a scenario assuming reduced air pollution controls and therefore increased aerosol emissions. This scenario also assumes no additional climate policies, as is the case with SSP5-8.5.

Which SSPs are available on ClimateData.ca?

ClimateData.ca hosts projections based on three scenarios (SSP1-2.6, SSP2-4.5, and SSP5-8.5), highlighted below. These were chosen because they span a wide range of possible future climates, have associated projections available from many different climate models, and have levels of Radiative Forcing that correspond with the three RCPs (high or RCP8.5, medium or RCP4.5 and low or RCP2.6) currently used on ClimateData.ca.

Figure 4: A depiction of global surface temperature changes (relative to pre-industrial levels) under the three SSP based emissions scenarios that will be found on ClimateData.ca. Note that the uncertainties associated with each projection are not depicted.

There are slight differences in the global average temperature changes associated with RCPs and SSPs of comparative Radiative Forcing values. These changes result from a slightly different mix of greenhouse gases in the SSP emissions pathways, and from the use of more recent climate models than those used with the RCPs.

Which SSPs do I use?

Every practitioner using future climate data will have to answer the question, “which SSPs should I consider?”  To do so, the practitioner will first need to answer a number of questions, e.g., What components of my project are vulnerable to climate change? What level of risk am I comfortable taking? What is the lifetime of my project?

In some situations, for example, when considering a major highway, the consequences of closure due to an extreme flood event or another rare but damaging environmental hazard can be very high, affecting local food security, national GDP, and public safety. Therefore, if tasked with planning to protect this highway from future climate threats, the costs of adapting to SSP5-8.5 (a “high carbon” scenario) up to the end of the century may be considered worthwhile. However, in other circumstances, where the consequences are lower and/or the likelihood of damaging events is low, adapting to SSP5-8.5 may not be necessary or economically viable. Regardless of the project and the rationale, the question of “how much risk am I comfortable taking” is complex, undoubtedly requiring conversations with diverse partners and stakeholder groups to understand the broad range of potential impacts and implications.

A project’s planning horizon is another important consideration during this process. Over relatively short periods (i.e., the next decade), the range of projected climate change between different SSPs is small. In this case, considering any SSP, rather than relying solely on historical data, may be the most important consideration. However, after the middle of the century, the climate projections for the scenarios quickly diverge, which could result in widely varying impacts between the scenarios.

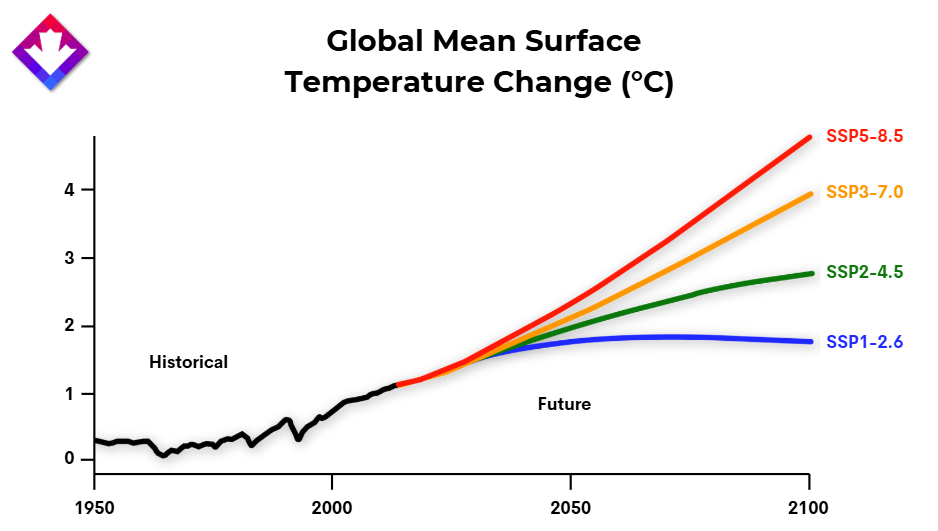
In applications not directly related to adaptation, where determining vulnerability and risk is not an important project component, the SSP selection process may consider additional factors. For example, of the SSPs, SSP5-8.5 projects the most global warming. As such, this SSP has a strong climate change signal compared to the background noise of natural climate variability. The strong signal to noise ratio may be useful in certain research contexts.

The complex nature of the climate system, climate models, and human factors makes it challenging to determine exactly how the climate will change.

What is known for certain is that the future climate will be different from the past and present. Regardless of which SSP ends up best reflecting the trajectory of climate mitigation, a certain amount of warming is already “locked-in”. By assessing more than one possible future, we can better prepare for a range of possible outcomes.

References

  1. Riahi K. et al. (2017): The Shared Socioeconomic Pathways and their energy, land use, and greenhouse gas emissions implications: An overview. Global Environmental Change 42: 153-168. https://doi.org/10.1016/j.gloenvcha.2016.05.009
  2. Carbon Brief (2018): Q&A: How ‘integrated assessment models’ are used to study climate change. https://www.carbonbrief.org/qa-how-integrated-assessment-models-are-used-to-study-climate-change/
  3. Meinshausen et al. (2020): The shared socio-economic pathway (SSP) greenhouse gas concentrations and their extensions to 2500. Geoscientific Model Development 13: 3571–3605. https://doi.org/10.5194/gmd-13-3571-2020.
  4. van Vuuren DP, Edmonds J, Kainuma M. et al.(2011): The representative concentration pathways: an overview. Climatic Change109, 5. https://doi.org/10.1007/s10584-011-0148-z
  5. Chen, D., M. Rojas, B.H. Samset, K. Cobb, A. Diongue Niang, P. Edwards, S. Emori, S.H. Faria, E. Hawkins, P. Hope, P. Huybrechts, M. Meinshausen, S.K. Mustafa, G.-K. Plattner, and A.-M. Tréguier, 2021: Framing, Context, and Methods. In: Climate Change 2021: The Physical Science Basis. Contribution of Working Group I to the Sixth Assessment Report of the Intergovernmental Panel on Climate Change[Masson-Delmotte, V., P. Zhai, A. Pirani, S.L. Connors, C. Péan, S. Berger, N. Caud, Y. Chen, L. Goldfarb, M.I. Gomis, M. Huang, K. Leitzell, E. Lonnoy, J.B.R. Matthews, T.K. Maycock, T. Waterfield, O. Yelekçi, R. Yu, and B. Zhou (eds.)]. Cambridge University Press, Cambridge, United Kingdom and New York, NY, USA, pp. 147–286, doi:10.1017/9781009157896.003.

For any questions about using climate data and information, please contact the Climate Services Support Desk.