Buildings

Climate variability and change have wide-ranging impacts on Canada’s built environment. The buildings sector module of ClimateData.ca provides easy access to building-relevant climate datasets, information, guidance, and case studies demonstrating the use of climate data in adaptation efforts for the Canadian building sector.

Overview

Buildings are intended to provide us with safe shelter from the outdoor environment. However, this functionality cannot be guaranteed under climate change. Read on to learn about how the building sector is responding and the resources currently available to help improve the climate resilience of buildings in the face of a changing climate.

Read further

Case Studies

Permafrost in the Northwest Territories

Thawing permafrost, one serious result of rapid warming in Canada’s Arctic, is causing widespread impacts to northern infrastructure. Using a climate risk analysis protocol (the PIEVC Protocol), a risk assessment was undertaken to better understand the threat from permafrost degradation in the Northwest Territories.

A Passive House University Residence Building

In order to meet its 2040 emissions targets, the University of Victoria is using Passive House standards, a high performance and low emission building standard, to construct two new residence buildings. This case study explores the application of future-adjusted weather files to ensure the buildings withstand future climate conditions.

Risks of Building Overheating in British Columbia

Overheating risks are increasing across Canada as the climate warms. Read on to learn about a non-profit housing provider’s journey to ensuring its buildings are climate-ready, and the importance of incorporating future climate data into building design as early as possible.

Blog Posts

January 23, 2023
Climate Data in Action: Future Weather Files

Pouriya Jafarpur and Ryan Smith, Canadian Centre for Climate Services

Topics

Buildings, Climate Data in Action, New and Noteworthy

Read more
December 15, 2022
Climate Data in Action: Costing Climate Change Impacts

Ryan Smith, Canadian Centre for Climate Services

Topics

Buildings, Climate Data in Action, Finance

Read more
October 25, 2022
Buildings Climate Zones Projections

Pouriya Jafarpur and Ryan Smith, Canadian Centre for Climate Services

Topics

Buildings, Climate Data

Read more

Sector Resources

Future Building Design Value Summaries

The Future Building Design Value Summaries are location-based summaries of the building design values developed by Environment and Climate Change Canada as part of the Climate-Resilient Buildings and Core Public Infrastructure (CRBCPI) project.

Analyze

For indices not included in the pre-calculated variable list, the Analyze page can be used to create custom indices, such as for Heat Waves.

IDF Curves and Climate Change

Learn how to use, read and interpret IDF curves, as well as how to account for extreme precipitation in a changing climate.

Learning Zone

Further information on using climate data or selecting a relevant historical dataset can be found in the Learning Zone.

Related Variables

Explore variables to learn about how data was used to impact climate related decisions in specific contexts.

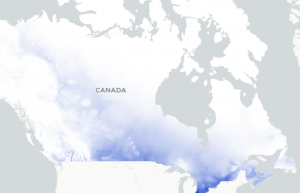
Cooling degree days (CDDs) give an indication of the amount of space cooling, i.e., air conditioning, that may be required to maintain comfortable conditions in a building during warmer months. When the daily average temperature is hotter than the threshold temperature, CDDs are accumulated (see Degree Days Above). Threshold  values may vary, but 18°C is commonly used in Canada.   Larger CDD values indicate a greater need for air conditioning.

Technical description:

The number of degree days accumulated above 18°C in the selected time period. Use the Variable menu option to view the annual, monthly or seasonal values for this index. Visit the Analyze page to calculate degree days using different threshold temperatures.


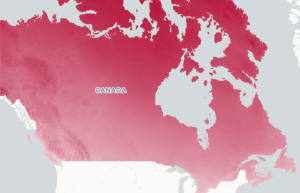
Heating degree days (HDDs) give an indication of the amount of space heating (e.g., from a gas boiler/furnace, baseboard electric heating or fireplace) that may be required to maintain comfortable conditions inside a building during cooler months. When the daily average temperature is colder than the threshold temperature, HDDs are accumulated (see Degree Days Below). Threshold values may vary, but 17°C or 18°C are commonly used in Canada. Larger HDD values indicate a greater need for space heating.

Technical description:

The number of degree days accumulated below 18°C in the selected time period. Use the Variable menu option to view the annual, monthly or seasonal values for this index. Visit the Analyze page to calculate degree days using different threshold temperatures.


Climate Zones for buildings are determined based on the unique climatic conditions of a particular region. The National Energy Code of Canada for Buildings (NECB) uses Heating Degree Days to define Climate Zones. In this case, Heating Degree Days (HDDs) are calculated using a threshold of 18°C. This metric indicates the potential heating required to maintain comfortable conditions inside a building.

Because the climate is changing, relying on historical data is no longer adequate and information about future climate is also required to design future-ready buildings.

Technical Description:

The NECB Climate Zones are classified based on the number of HDDs. The thresholds are shown in the table below.  Additional guidance about Climate Zones for buildings can be found on the Learning Zone.

NECB’s Building Climate Zone Classifications for Canada.

Zone Heating Degree-Days of Building Location
Celsius Degree-Days
4 < 3000
5 3000 to 3999
6 4000 to 4999
7A 5000 to 5999
7B 6000 to 6999
8 ≥ 7000

The Future Building Design Value Summaries are location-based summaries of the building design values developed by  Environment and Climate Change Canada as part of the Climate-Resilient Buildings and Core Public Infrastructure (CRBCPI) project.

The values are obtained from the Pacific Climate Impacts Consortium (PCIC)’s Design Value Explorer and are summarized into a table alongside relevant supporting guidance and information for every location in the National Building Code of Canada (NBCC, 2015).

Historical values are from the NBCC 2015, Table C-2* while the future values are derived from regional climate model simulations (CanESM2-CanRCM4) and are presented for two levels of global warming 1.5°C and 3°C above the 1986-2016 baseline period.

These summaries are tailored to users who would consult the NBCC as part of their work, for climate-related design and planning needs.

Read more

This future-looking information comes with an associated uncertainty, as fully described for each design value element in the CRBCPI.

In brief, Tier 1 variables are those for which there is generally high or very high confidence in the future projections for a given level of global warming. These variables reflect the well-understood thermal response of the climate to external radiative forcing of the Earth system.

  • heating degree days
  • hourly design temperatures (January 2.5% dry bulb, January 1% dry bulb, July 97.5% dry bulb, and July 97.5% wet bulb)

Tier 2 variables are those for which there is generally medium confidence in the future projections for a given level of global warming.

  • annual total precipitation and annual total rainfall
  • annual maximum 1-day rain (50-yr return period)
  • annual maximum 15-min rainfall (10-yr return period)

Tier 3 variables are those for which there is low or very low confidence in the future projections for a given level of global warming.

  • annual maximum hourly wind pressures (10- and 50-yr return periods)
  • annual maximum driving rain wind pressures (5-yr return period)
  • annual maximum snow load & rain-on-snow load (50-yr return period)

Additional guidance on use of the Design Value Explorer and the associated data can be found in the Learning Zone and under the ‘About’ tab in the tool on PCIC’s website

*Historical values are derived from records prior to 2008 for most variables. At two locations (Pine Falls, MB and Boiestown, NB), historical values were provided by PCIC as these locations had problematic or missing data.