IDF stands for intensity, duration and frequency. As the name suggests, IDF data presents information about how frequently a location experiences rainfall events of varying intensities and durations. Conventionally, IDF information (tables and graphs) is developed using historical rate-of-rainfall data. However, IDF information based solely on an analysis of historical data is not suitable for understanding future risks. Furthermore, because our climate is already changing, historical IDF data may not even be well suited for the present day.
We are very happy to announce the launch of new IDF data on ClimateData.ca that represent the influence of projected climate change. The new data have been computed using the temperature-scaling method outlined in this Learning Zone article.
What is temperature scaling? And how can these new data be accessed and used appropriately? This blog post dives into this rich new dataset to answer these questions.
First, a bit more information about modelling extreme rainfall
Climate change has intensified extreme rainfall events in North America, a trend that is expected to continue into the future. However, due to the challenges described in our Primer on Climate Change and Extreme Precipitation, climate models have limitations in their ability to simulate short duration rainfall events.
Fortunately, there is strong evidence to suggest that the intensity of extreme precipitation is linked very closely to temperature: as temperature increases, so does precipitation intensity, by a general factor of around 7% for every 1˚C increase in temperature (see Primer on Climate Change and Extreme Precipitation for more information about this relationship).
This relationship is remarkably powerful despite its simplicity, because it allows future estimates of precipitation to be made based on temperature projections, which are well-simulated by global climate models. Expressing relative changes in rainfall extremes as a function of warming is often referred to as “temperature scaling”. It is also sometimes called “Clausius-Clapeyron scaling”.
How to access climate change-scaled IDF information on ClimateData.ca
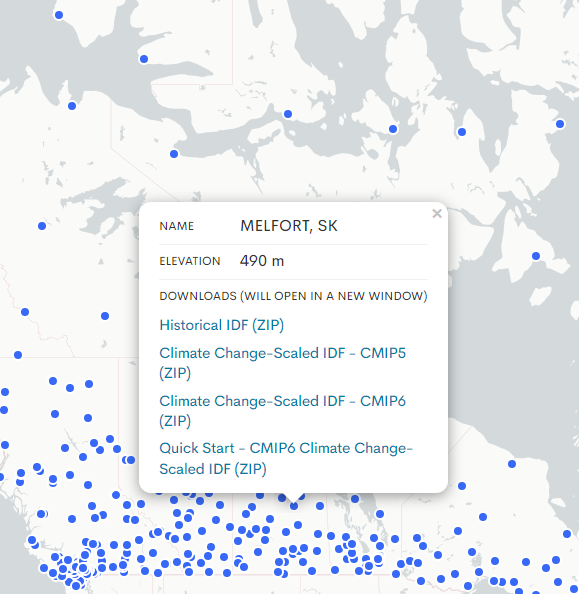
Accessing the new data is easy. Users simply explore this IDF station map – which can also be found under Station Data in the Variable menu – and click on a station of interest. Doing so opens a pop-up, which contains a number of different IDF products in zipped folders, including historical IDF information, full datasets, and a “Quick Start” dataset.
In anticipation of a full CMIP6 data release later this year on ClimateData.ca – the latest phase of the Coupled Model Intercomparison Project – we are releasing climate change-scaled IDF data for both CMIP5 and CMIP6. The ClimateData.ca team recommends that you use CMIP6 for new work requiring future climate projections; the CMIP5 projections are still valid and it is not necessary to re-do work that used these projections.
The CMIP5 and CMIP6 ZIP files contain technical documentation and four folders each, with the historical data and one for each future scenario (see our article on future scenarios to learn more). Each folder in turn contains multiple CSV files, which can be opened in Microsoft Excel. Each CSV file contains data averaged across rolling 30-year future periods. For example, the CSV file titled “MELFORT_4055079_52.82_104.6_rcp85_2071-2100.csv” contains data averaged across the period 2071-2100.
The CMIP6 Quick Start dataset provides only five CSV files in total: the historical IDF data, and mid-century (2041-2070) and end-of-century (2071-2100) data for the moderate and high emissions scenarios.
How to read and interpret these data
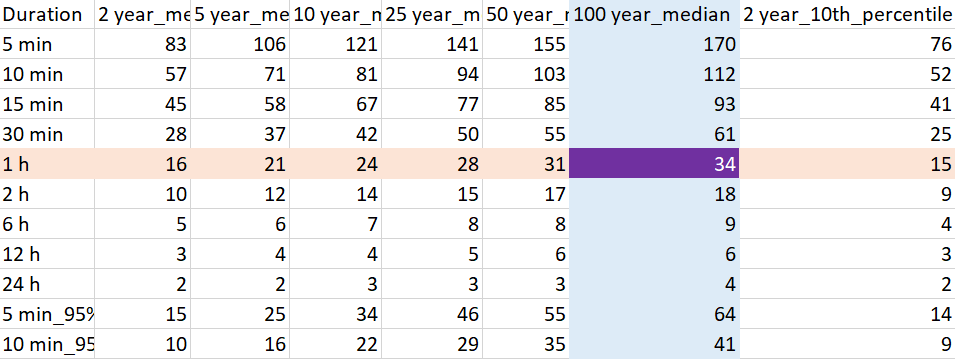
Once you learn how these spreadsheets are organized, reading the data is straightforward. Rows are organized by rainfall duration (i.e. a 5min, 10min, 30 min, 1 hour, etc. rainfall event) and columns by return period, which represents the frequency of occurrence (learn more return period in our learning zone article on IDF curves). The values inside the spreadsheet cells contain rainfall intensities, or the rate of rainfall given in units of mm/hr.
In the example shown below, a rainfall intensity of 34 mm/hr, persisting for 1 hour, is expected to occur on average every 100 years, under this particular future scenario and future time period.
What are some best practices when using these data?
We’ve put together a list of important things to keep in mind when using IDF values.
It is important too to acknowledge uncertainty in future climate projections, which is why scenario-based data and the ensemble median as well as the 10th and 90th percentiles are provided. Together, these show the range of possible future rainfall events, under a range of possible climate futures. Risk-based decision-making can be used to choose the future extreme rainfall value that is most appropriate for your asset’s risk thresholds.
If further support is required with regard to IDF information, please consult the ClimateData.ca Learning Zone. Here users will find learning modules dedicated to IDF curves, including best practices and caveats when considering climate change-scaled IDF values. For any additional support, please contact the CCCS Support Desk.
And, we would very much like to hear from you. Are you using this information to make climate-informed decisions? What would make this information more useful to you? Please take the time to send us an email with your opinions, and share this brief with your colleagues.