Get Climate Smart: Protecting Health and Wellbeing

How ClimateData.ca supports adaptation efforts in the health sector

Health professionals are witnessing the impacts of climate change, recognizing it is not merely an environmental issue but also a critical threat to human health. The 2021 heatwaves in British Columbia, which a recent study found were made 150 times more likely due to climate change[1], not only resulted in the loss of over 600 lives but also created extreme fire weather conditions. These conditions were a key factor in the catastrophic Lytton fire.

In Canada, health and wellbeing are a key pillar of our National Adaptation Strategy. As Canada’s Chief Public Health Officer, Dr. Theresa Tam, tells us: “The emergency is at our doorsteps. You can’t actually ignore it. So we do have to seize this moment to get all of us better prepared.”

Recognizing these health vulnerabilities, organizations like Health Canada are developing valuable resources to educate the public about the direct and indirect health risks of climate change. Their efforts emphasize the importance of focusing on communities most impacted by climate change and providing strategies for health organizations across the country to protect against climate change’s health impacts. Programs like these have been instrumental in this endeavor, helping the health sector prepare for and respond to the impacts of climate change.

This is where platforms like ClimateData.ca step in. ClimateData.ca is a website that provides future climate projections that can help decision makers build a more resilient Canada. The ClimateData.ca team work to integrate climate data with the insights and recommendations from Health Canada to deliver actionable strategies for health professionals. Through the ClimateData.ca Health Sector Module, health case studies, health-related climate indices, and climate data tools, we aim to build climate literacy among health professionals and inspire adaptation actions. Together, these initiatives signify Canada’s proactive approach to safeguarding its residents from the increasing health risks posed by a warming world. Here are a few ways that health professionals can use the site to take their climate adaptation efforts to the next level.

A menu of climate data supports for health

1. Get inspired by Health Sector Module Case Studies

Climate adaptation within the health sector involves a multifaceted approach, encompassing initiatives such as reducing the impacts of climate-related disasters, enhancing health and well-being, promoting the protection and restoration of nature and biodiversity, and developing resilient infrastructure. The health sector module includes a variety of case studies that exemplify these diverse strategies, offering inspiration and guidance for future adaptation efforts. These case studies illustrate:

A. The effects of climate change on hospitals: With British Columbia adapting to a new climate reality, studies are suggesting renovations to the existing health infrastructure. Recommendations include the introduction of new building codes tailored to withstand future climatic challenges.

B. Physical and mental health impacts  in New Brunswick: Extreme weather events, such as floods causing coastal erosion and infrastructural damage, aggravate both physical and psychological health conditions in New Brunswick. Learn about how coping strategies and programs can help mitigate these effects, including heat alert systems, public education programs on various health risks, self-help and mental health support initiatives.

C. Drought and Human Health in Canada: The multifaceted impacts of droughts on human health and well-being are expected to amplify with the advancing climate crisis in Canada. In efforts to assess vulnerability to climate change impacts on health, for example by partners in Canada’s HealthADAPT initiative, public health officials can use meteorological information and climate scenarios to understand current impacts of drought events and how exposures may increase due to climate change. Read about innovative adaptation methods such as the Invitational Drought Tournament (IDT) that was developed by Agriculture and Agri-Food Canada.

D. Extreme heat waves in Québec: Recent heat waves, specifically in 2010 and 2018, provide insights into temperature-related health hazards. Read about how public health initiatives are helping to reduce the adverse effects of heat waves, including the monitoring of deaths and hospitalizations during extreme heat events, the issuing of extreme heat warnings, cross-sector coordination of emergency plans, reducing urban heat islands, and the use of climate projections to inform the decisions made by public health and urban planning officials.

E. Lyme disease in Ontario: Eastern Ontario is witnessing a surge in Lyme disease cases, a trend anticipated to persist with the progression of climate change. Surveillance of Lyme disease cases in humans and the tick’s geographic range guides clinical and public health interventions to prevent, detect and mitigate the effects of Lyme disease.

2. Explore Climate Indices

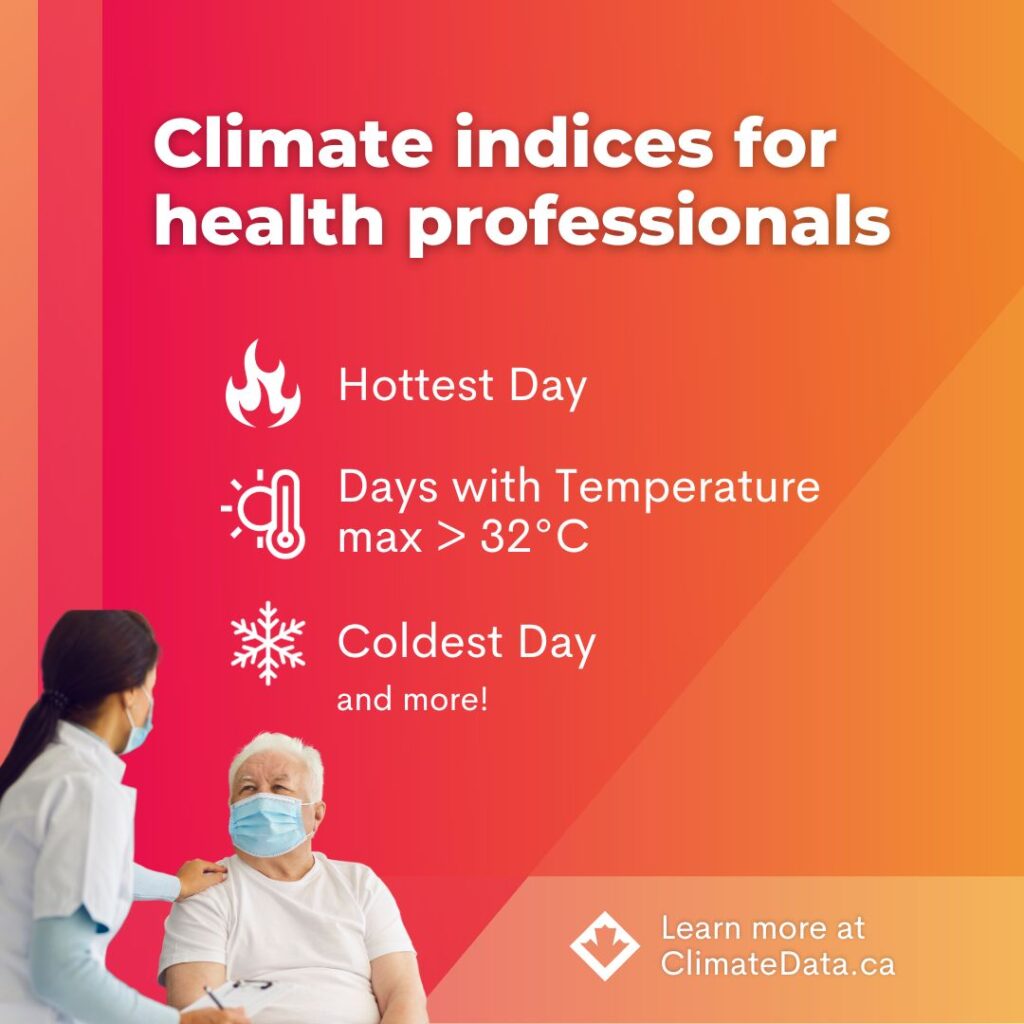
For those who are ready to dive into climate data and communicate risks, there are a number of pre-computed climate data indices users can browse, visualize, and download that pertain to the health sector, namely:

A. Hottest Day: As the name suggests, this index describes the average hottest day of the year for a location. Very hot daytime temperatures influence the suitability of a particular place for flora and fauna, dictate architectural decisions, and guide energy consumption. Furthermore, extreme heat can jeopardize human health, with the elderly being particularly susceptible to heat-related ailments.

B. Days with Tmax > 32°C: The average number of days per year when the daytime temperature exceeds 32°C is an important variable to understand in order to accommodate such temperatures in daily life and urban planning. Extreme heat can lead to dehydration, heat stroke, and in extreme circumstances even death. The elderly and those with existing medical conditions, but also outdoor workers, athletes and people without homes, are particularly vulnerable to extreme heat conditions. As Canada’s climate warms, the frequency and severity of heatwaves are expected to increase. This is expected to be particularly impactful in areas such as Canada’s north, where communities are less prepared to cope with extreme temperatures.

C. Coldest Day: As with the Hottest Day index, this index describes the average coldest day of the year for a location. While Canada is no stranger to frigid temperatures, these cold spells have profound implications on health, specifically exposure to cold temperatures can, in extreme cases, lead to hypothermia. Cold temperatures can also affect our health and safety by determining what plants and animals can live in the area, limiting or enabling outdoor activities, defining how we design our buildings and vehicles, and shaping our transportation and energy use. Overall, Canada is projected to experience fewer and less persistent instances of extreme cold temperatures in the future.

D. Wet Days >= 20mm: Cataloging days with precipitation (rain and snow) of at least 20mm, this index can be used to gauge changing rainfall intensity and frequency. Changes in precipitation can affect human well-being and the ecosystems we depend on, including impacts to the quality and availability of drinking water.

E. Tropical Nights (Days with Tmin > 22°C): Tropical Nights are nights when temperatures remain above 22°C. Tropical nights make it more difficult for the body to cool down and recover from hot days, which can cause heatstroke and heat exhaustion, and can worsen existing medical conditions. Elderly people, people without homes, and those who live in houses or apartments without air conditioning are especially vulnerable during these heat events, particularly if they last for more than a few days.

3. New Future Humidex Projections

You don’t have to be a climate data expert to gain valuable insights for health interventions. ClimateData.ca contains a number of tools to help make the links between climate variables and adaptation insight.

For example, Humidex is more than just a measure of summer comfort. By combining temperature and humidity, it gives a comprehensive representation of how the hot and humid weather feels to the human body, contributing to the heat stress and discomfort that individuals might experience. While areas like southern Ontario, Manitoba, Quebec, Alberta, and Saskatchewan were historically familiar with high Humidex values, recent climate patterns have seen this index rise in regions previously untouched by such extremes. This shift underscores the urgency for health professionals to incorporate Humidex data into their climate change and health vulnerability assessments.

4. Try out the Spatial Analogues Tool

The Spatial Analogues app is one of ClimateData.ca’s newest and most powerful tools. It provides a novel way of visualizing future climate changes by allowing users to envision and prepare for their city’s future climate by exploring cities that are already experiencing similar climatic conditions. Take Québec City as an example. As the climate warms, the city will experience considerable climatic changes—from more frequent and intense heat to shifting precipitation patterns. Are there locations we can look to now that have temperature and precipitation regimes that are similar to Québec City’s projected future climate?

In the words of one health-based user of this tool, “Our vulnerability assessment included comparison cities for 2020s, 2040s and 2080s. When we use these to communicate with partners they ‘get it’ and are shocked! It makes temperature change tangible!”

5. Perform custom heat wave calculations using the Analyze Page

For those who want a tailored approach to understanding climate data, the Analyze page at ClimateData.ca offers a useful platform for customization without the need for coding skills. Users can pinpoint specific grid cells (or areas such as health regions), set unique thresholds for various climate indices, including heat waves, and customize their analysis by choosing the emission pathways, and percentiles relevant to their study. As an example of this in action, consider the temperature thresholds used in southern Alberta to determine if a heat warning should be issued to the public: Daytime temperatures exceed 32°C for two consecutive days with nighttime temperatures not dropping below 16°C. By using these criteria to define a heatwave, users can see how the number of heatwaves may increase in the future under different warming scenarios.

This customizability ensures that health professionals across various regions can proactively strategize and take measures to protect communities from the adverse effects of extreme temperatures, making this tool essential in heat health planning. Users with strong programming capabilities may also consider using PAVICS, another climate data tool maintained by Ouranos for climate researchers and scientists.

Tap into an ecosystem of climate data supports

Healthcare providers are already on the frontlines of climate impacts, and they need to be ready for accelerating change. Vulnerable populations are hit hardest during heatwaves, and ignoring the change in climate patterns could lead to ill-prepared communities and overwhelmed healthcare systems during extreme heat events.

The good news is there are countless opportunities to improve health conditions while addressing climate risks. Meeting the needs of communities at risk means anticipating climate changes, aiding in optimizing infrastructures like cooling centres, and leveraging cutting-edge tools to enhance our public health responses.

ClimateData.ca is a resource for any health professional who wants to understand the health risks of climate change. Through this portal, climate and health professionals can work together to inspire action to prepare for climate change and foster health equity.


[1] Philip, S. Y., Kew, S. F., van Oldenborgh, G. J., Anslow, F. S., Seneviratne, S. I., Vautard, R., Coumou, D., Ebi, K. L., Arrighi, J., Singh, R., van Aalst, M., Pereira Marghidan, C., Wehner, M., Yang, W., Li, S., Schumacher, D. L., Hauser, M., Bonnet, R., Luu, L. N., Lehner, F., Gillett, N., Tradowsky, J. S., Vecchi, G. A., Rodell, C., Stull, R. B., Howard, R., and Otto, F. E. L.: Rapid attribution analysis of the extraordinary heat wave on the Pacific coast of the US and Canada in June 2021, Earth Syst. Dynam., 13, 1689–1713, https://doi.org/10.5194/esd-13-1689-2022, 2022.