Seasonal Forecasts vs. Climate Projections

Learn about the key differences between seasonal forecasts and climate projections and how to choose the right type of dataset for your project.

Time to completion
20 min

Key Messages

  • Both seasonal forecasts and climate projections can support decision-making. Seasonal forecasts can support planning for the upcoming 12 months, while climate projections can support longer-term planning over 30-year periods until the end of the century (2100).
  • Seasonal forecasts describe how overall climate conditions (e.g., mean temperature, total precipitation) for a future three-month period may compare to typical historical conditions for that period.
  • Climate projections represent future climate conditions based on the greenhouse gas emissions associated with different socio-economic development pathways.
  • Seasonal forecasts are not available for different socio-economic pathways because changes in greenhouse gas emissions have a negligible impact on climate on these timescales.
  • The seasonal forecasts coming to ClimateData.ca are produced using the Canadian Seasonal to Interannual Prediction System version 3 (CanSIPSv3).
  • The downscaled climate projections have been developed using ensembles of climate models that are included in the Coupled Model Intercomparison Project (CMIP).

What are seasonal forecasts and climate projections?

Both seasonal forecasts and climate projections provide insights into possible future climate conditions but on different timescales; as a result, they have different uses for decision-making and planning.

Seasonal Forecasts

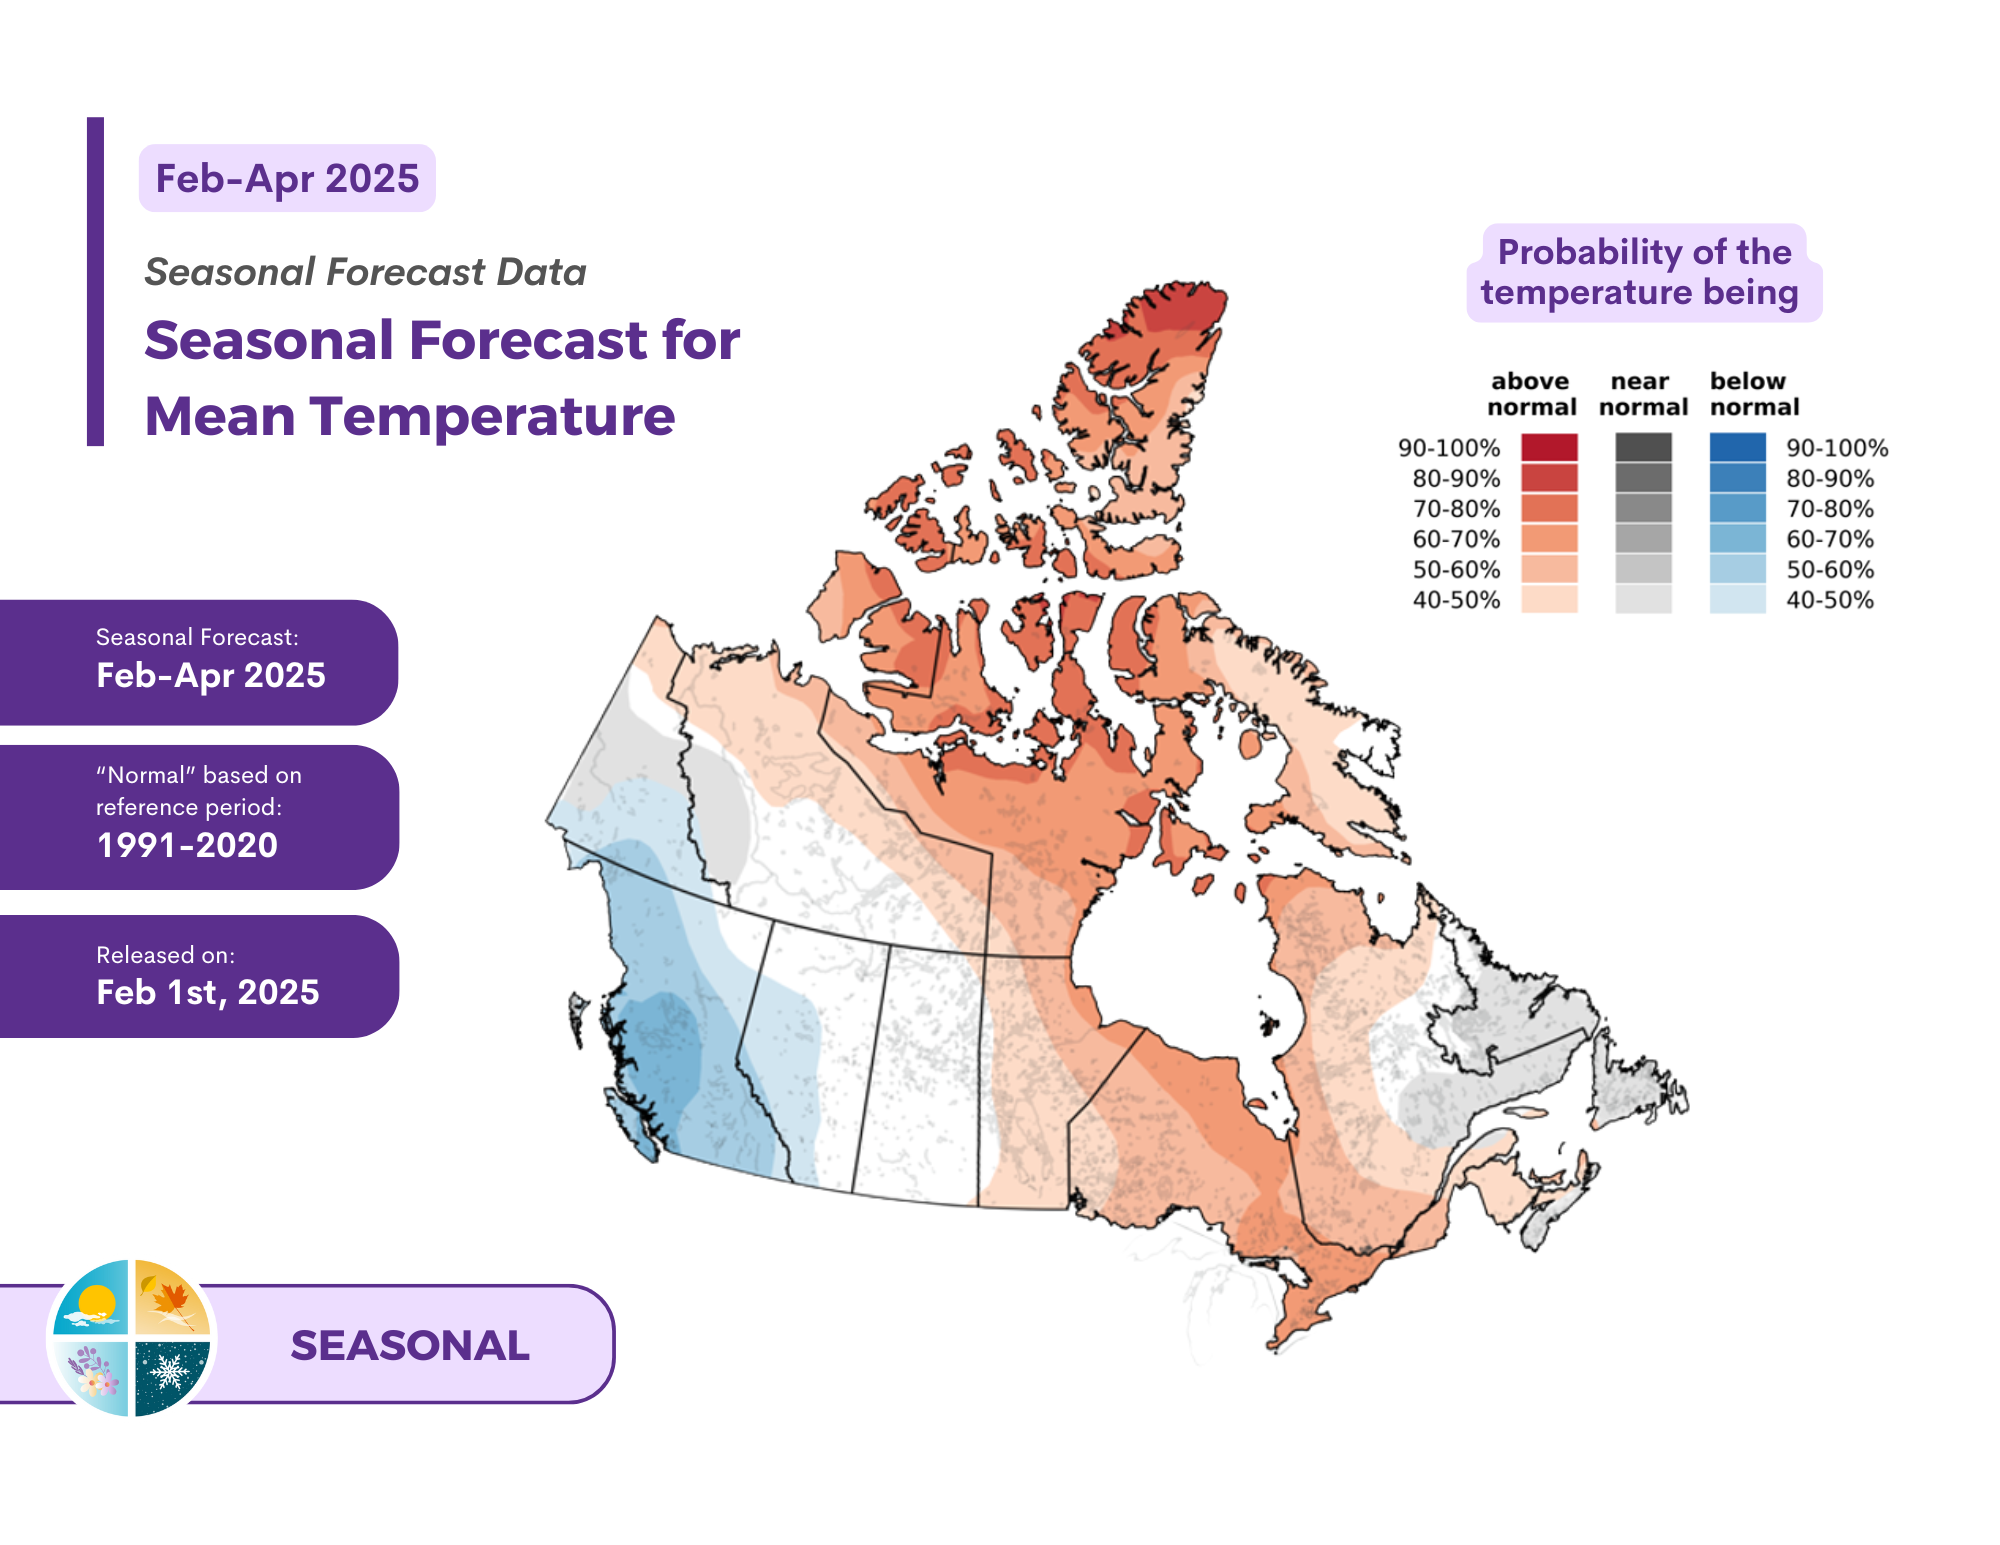
Seasonal forecasts provide information about the overall climate conditions (e.g., mean temperature, total precipitation) for a future season, defined on ClimateData.ca as a 3-month period in the next 12 months. Seasonal forecasts most commonly show the probability of a variable being above, near, or below normal. Other specialized seasonal forecast products will also be available (e.g., probability of unusually high or unusually low temperatures). Seasonal forecasts do not predict daily or weekly weather within a season2.

Seasonal forecasts are usually updated monthly. An example of a probabilistic seasonal forecast is shown in Figure 1. Learn more about seasonal forecasts in the What Are Seasonal Forecasts? article.


Figure 1: Seasonal forecast released on February 1st, 2025, for February to April 2025 for mean temperature across Canada. The forecast shows the probabilities of above, near, and below normal outcomes.

Climate Projections

Climate projections provide a range of plausible future climate conditions resulting from greenhouse gas emissions scenarios associated with different socio-economic development pathways extending to 2100. Climate projections data are typically presented as multi-decadal averages. Generally, 30-year periods should be considered when making decisions concerning future climate change or determining how the climate has changed at a specific location. For example, a summer temperature projection for 2041 to 2070 describes average summer temperatures over that 30-year period. For information about why climate projections are usually presented as multi-decadal averages, go to the Importance of Using 30 Years of Data.

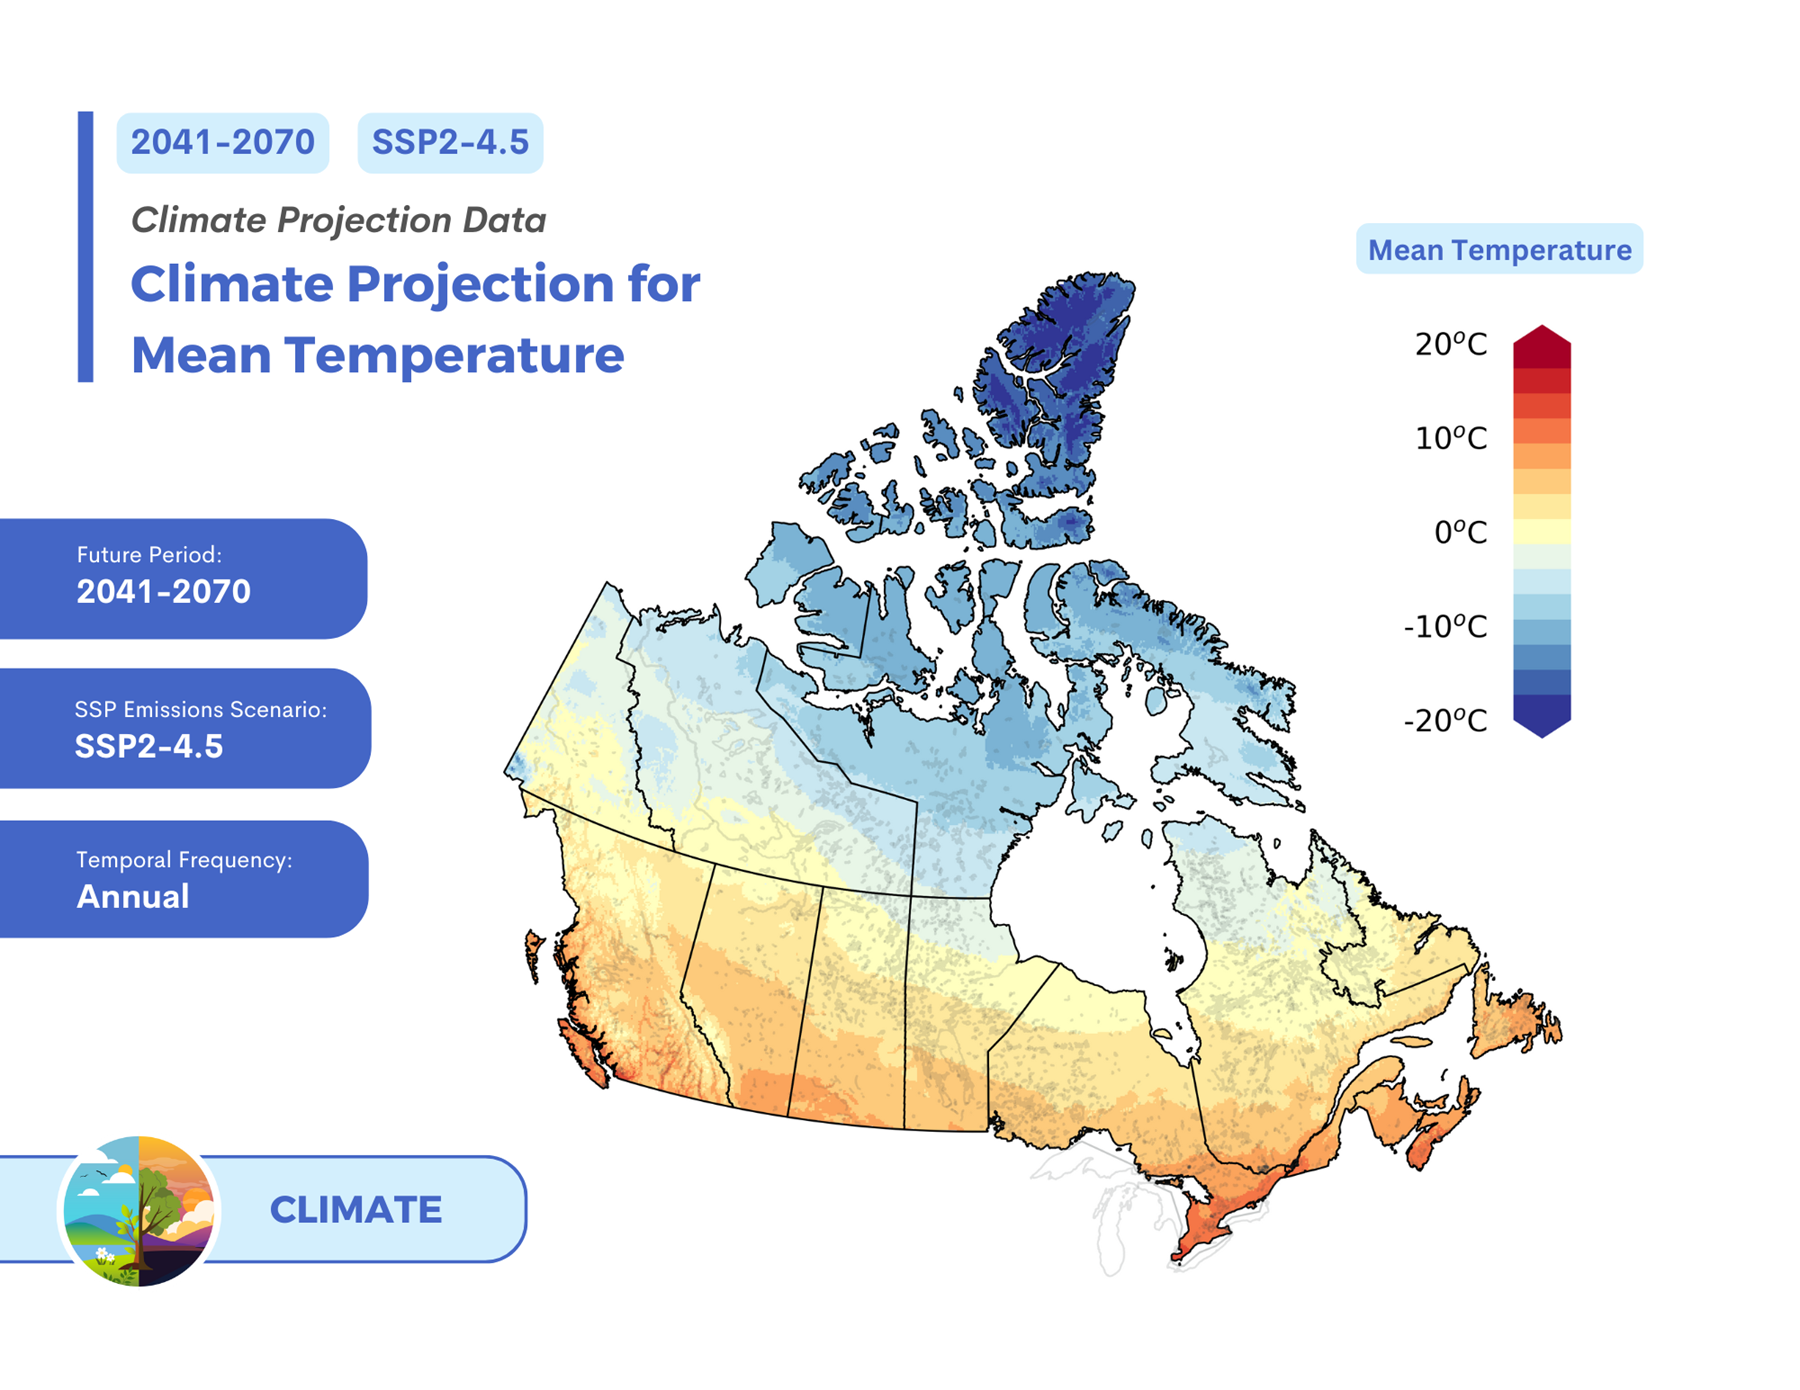
Climate projections are usually presented as median values and ranges from an ensemble of climate models, and are periodically updated as new phases of the Coupled Model Intercomparison Project (CMIP) are completed. An example of a climate projection is shown in Figure 2. Learn more about climate projections in the Learning Zone Topic 3: Understanding Future Projections.


Figure 2: Climate projection for 2041 to 2070 of annual mean temperature across Canada for shared socio-economic pathway (SSP) emissions scenario SSP2-4.5. The values are in degrees Celsius. This map shows the median values from an ensemble of multiple climate models.

Which dataset do I need?

The type of climate dataset that is most appropriate is often determined by the timescale of interest, such as the timescale during which actions will be taken or the lifespan of the project.

Seasonal Forecasts

Seasonal forecasts provide information about the probability that conditions will differ from historical seasonal conditions and can be used to weigh the benefits and risks of different actions4. Unlike climate projections, seasonal forecasts start from observations of recent climate. The seasonal prediction system uses these recent observations (called initial conditions) as a starting point for simulating future climate conditions to produce a forecast. This makes seasonal forecasts useful for planning over future seasons in the upcoming year. For example, seasonal forecasts may be used to estimate how variables related to agriculture may impact an upcoming growing season. This information could be used to facilitate planning and decision-making by growers.

Climate Projections

Unlike seasonal forecasts, observations of recent climate are not directly used in the development of climate projections. Global climate models simulate the projected climate changes that result from different scenarios of greenhouse gas emissions. This makes climate projections most useful for planning over future time horizons extending from mid- to late- century (2100), when the effect of these emissions on the climate is evident. The projections can be used for decision-making now because the climate has already changed compared to historical baselines and because the decisions made today can impact climate readiness far into the future. For example, climate projections may be used to understand how variables relevant to infrastructure design have and will continue to change over this century. Infrastructure lifespans can be many decades, meaning that long-term changes in climate should be considered in planning and decision-making.

Sources of predictability

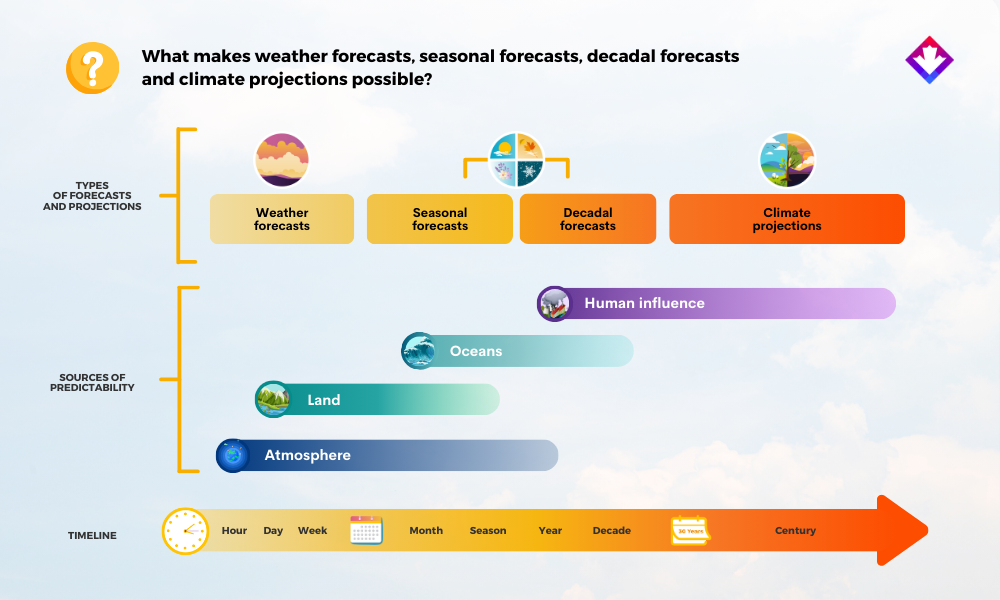
Atmosphere, land, oceans, and human activities all influence the climate on timescales from days to centuries. These influences are included in climate models and provide the predictability needed to produce seasonal forecasts and climate projections, as shown in Figure 3. Different sources of predictability influence the climate more strongly on different timescales (e.g., months, seasons, decades).


Figure 3: The atmosphere, land, oceans, and human influence affect the climate on timescales from days to centuries, however their influences are felt more strongly at different timescales. Weather and climate models use these sources of predictability to produce weather forecasts, seasonal forecasts, decadal forecasts, and climate projections. Figure adapted from Merryfield et al3.
Seasonal Forecasts

Seasonal forecasts are largely influenced by changes in the ocean and the natural climate variability linked to those changes, such as the El Niño-Southern Oscillation (ENSO) which includes El Niño and La Niña. However, changes in the land and atmosphere also influence seasonal forecasts. While some atmospheric changes are somewhat predictable at seasonal timescales, most atmospheric changes including daily weather are unpredictable that far ahead. As a result, precise forecasts aren’t possible for individual days or weeks in future seasons. However, seasonal climate conditions can be forecast based on how the land and ocean evolve on seasonal timescales.

Climate Projections

Climate projections differ considerably depending on which emissions scenario is used to drive the climate models. Projections are shown as a range of possible futures extending to 2100. Natural variability in the climate system is also present in climate projections. The relative importance of different sources of uncertainty depends on the time period and variable of interest. Determining how much the climate will change in the future strongly depends on societal growth and development patterns. Learn more about emissions scenarios used in CMIP6, including how emissions scenarios are defined and the differences between them, in the Understanding Shared Socio-economic Pathways (SSPs) article.

Variables

Seasonal forecasts and climate projections may be available for the same variables and indices; however, these data products are produced differently and are not directly comparable. It’s important to understand the variables or indices used, as well as their units of measurement.

Seasonal Forecasts

Seasonal forecasts commonly include mean (or average) temperature and total precipitation variables, but forecasts coming to ClimateData.ca will also include many other variables and indices. Seasonal forecasts are most often presented as probabilities (expressed as percentages) of the variable being above, near, and below normal.

Climate Projections

Climate projections are available for a variety of variables and indices. The variables and indices available on ClimateData.ca can be found on the ClimateData.ca All Variables webpage. Climate projections for most variables are presented as either the projected future value in physical units or the difference between the projected future value and the modelled historical climatology (i.e., delta value). For example, projections of mean temperature are shown in degrees Celsius, and projections of total precipitation are shown in millimetres.

Historical Data

Different historical datasets are used for the reference period (i.e., the baseline period) for seasonal forecasts compared to climate projections.

Seasonal Forecasts

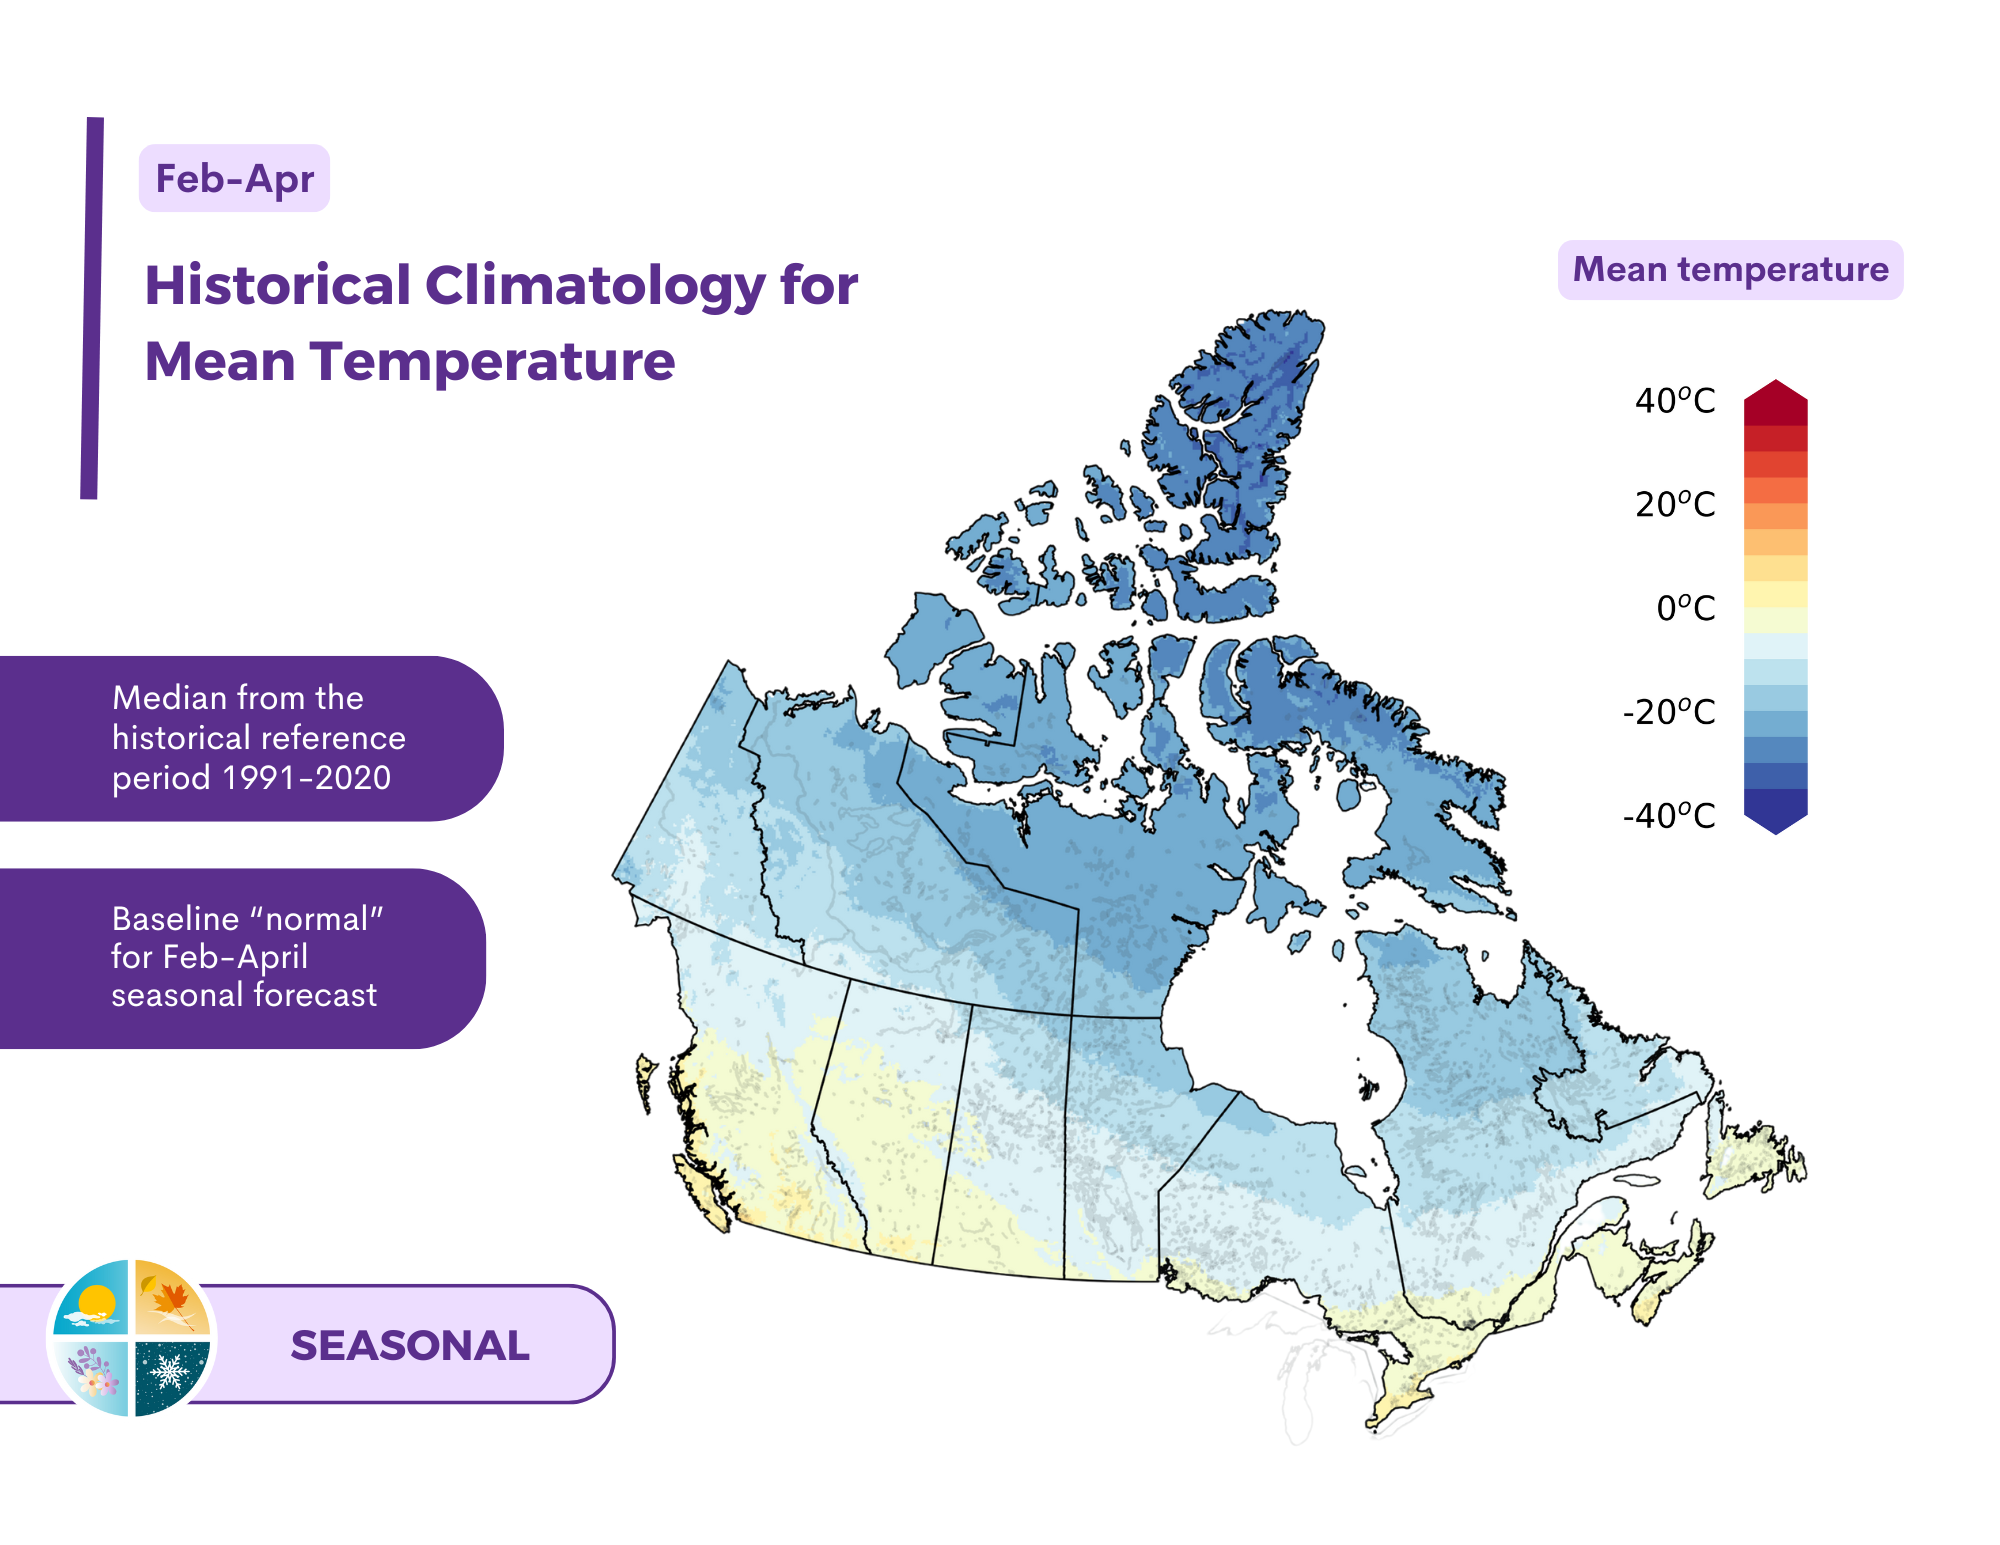
Seasonal forecasts should be compared to an observed historical climatology, which describes historical conditions using actual observations of the climate system. The observed historical climatology for different seasons and variables is used to determine the “normal” conditions for each season. The climatology from 1991 to 2020 will be provided as part of the probabilistic forecasts on ClimateData.ca as exemplified for temperature in Figure 4. The observed historical climatology should match the season being forecasted. For example, on ClimateData.ca, a forecast for February to April in the current year will be compared with the observed historical average over 1991 to 2020 for February to April.


Figure 4: Observed historical climatology for February to April for mean temperature in degrees Celsius averaged over 1991 to 2020.

Climate Projections

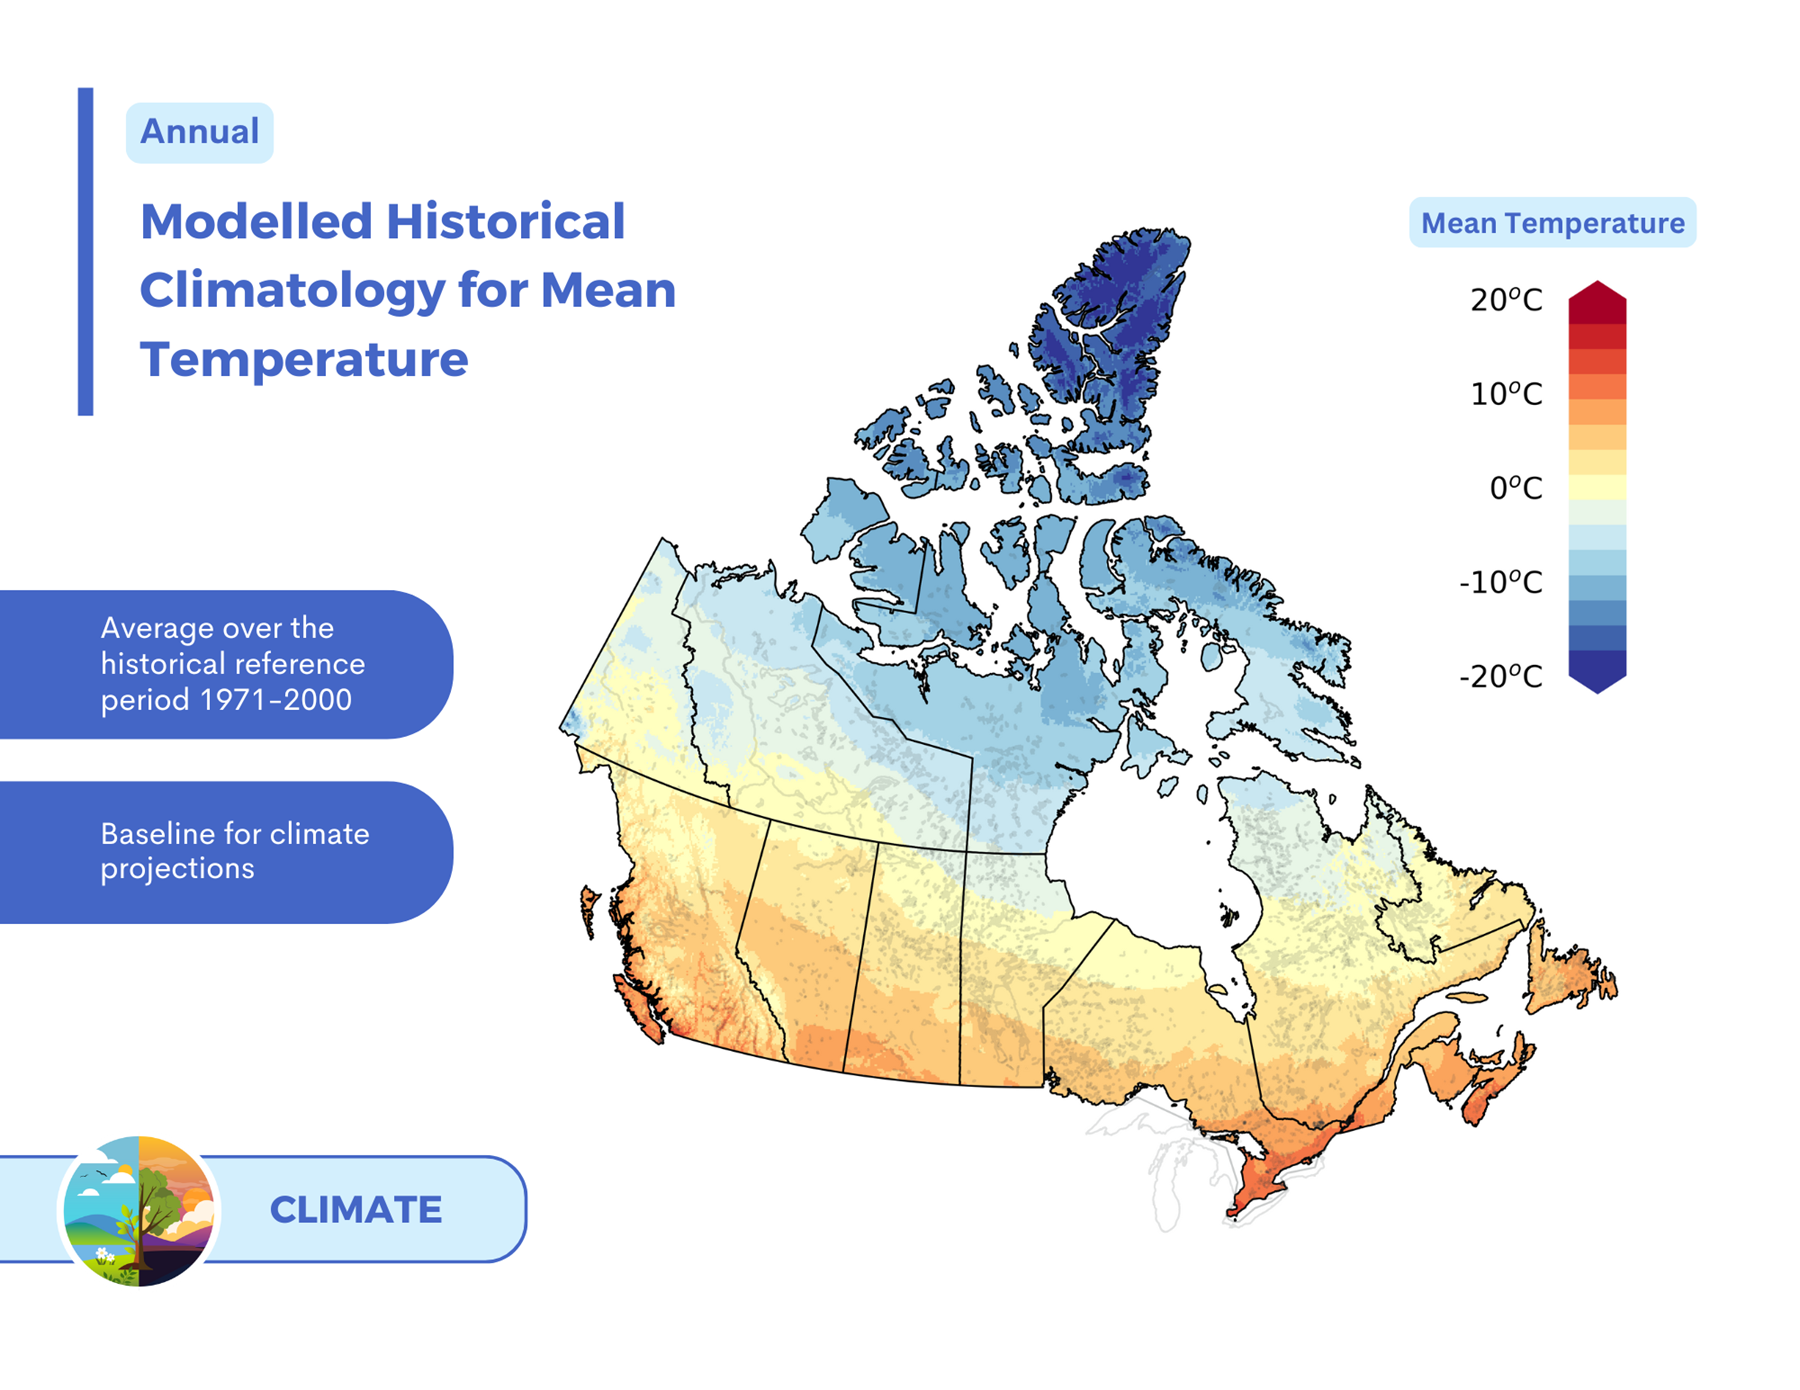
It is recommended that data from the CMIP modelled historical climatology be used to compare historical trends to future climate projections rather than historical observation data from weather stations. Learn more in the Which Historical Data Set Should I Use? article. Figure 5 illustrates the modelled historical climatology for temperature on ClimateData.ca. When comparing historical climate conditions to future climate projections, the same temporal frequency as the climate projections (e.g., monthly, annual, seasonal) should be used. For example, for 30-year average projections for August of 2031 to 2060, the monthly modelled historical climatology for August 1971 to 2000 could be used as a historical reference period. See link for more information on historical baseline periods.


Figure 5: Modelled historical climatology for annual temperature in degrees Celsius for a commonly used historical reference period of 1971-2000 (30-year average). This map shows the median values from an ensemble of multiple climate models.

Modelling Methods

Seasonal forecasts and climate projections are produced differently.

Seasonal Forecasts

The seasonal forecasts coming to ClimateData.ca are produced using the Canadian Seasonal to Interannual Prediction System version 3, commonly known as CanSIPSv3, which forecasts changes in climate conditions globally for the upcoming 12 months. CanSIPSv3 uses two coupled atmosphere-ocean-land climate models: the CanESM5 model and the GEM5.2-NEMO model. CanSIPSv3 forecasts are generated using an ensemble of 40 model simulations with 20 model simulations from each of the two models1.

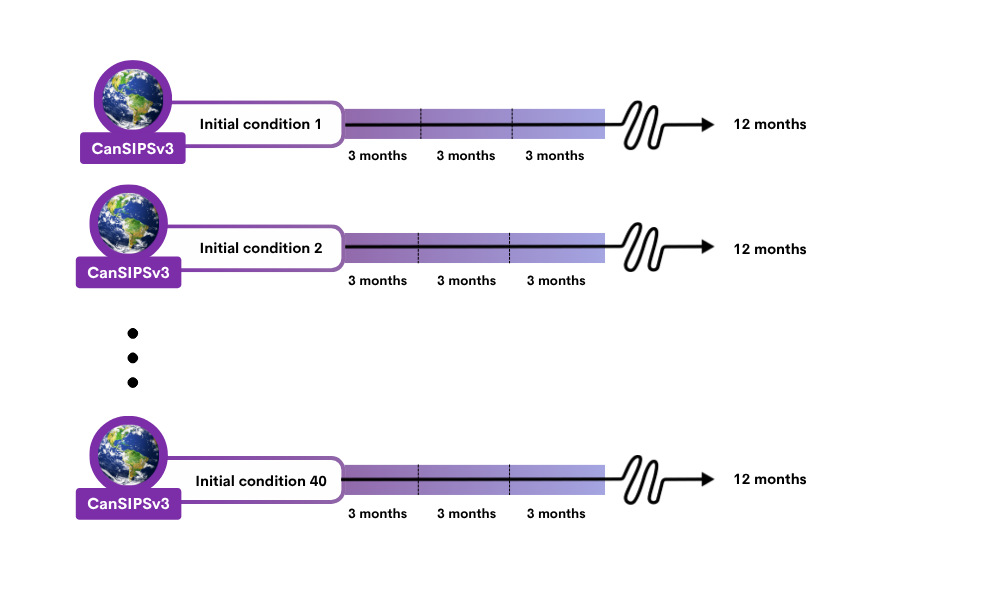
The purpose of the ensemble is to provide a representation of the uncertainty in the forecasts arising from our imperfect knowledge of initial conditions and the chaotic nature of the climate system. Seasonal forecasts are generated from the ensemble, which is a set of many individual model simulations from the CanSIPSv3 seasonal prediction system that have slightly different starting points or initial conditions. The initial conditions are based on a range of possible initial states of the climate system that are consistent with observed conditions at the start time of the forecast. The seasonal prediction system is run forward in time, and the resulting values from these model simulations are then used to produce a probabilistic forecast. Figure 6 illustrates how an ensemble is produced.

Technical documentation for CanSIPSv3 is available here.


Figure 6: The seasonal prediction system (CanSIPSv3) is run forward in time with different initial conditions to generate an ensemble. This ensemble of model simulations is used to produce the probabilistic seasonal forecasts for seasons in the upcoming 12 months.

Climate Projections

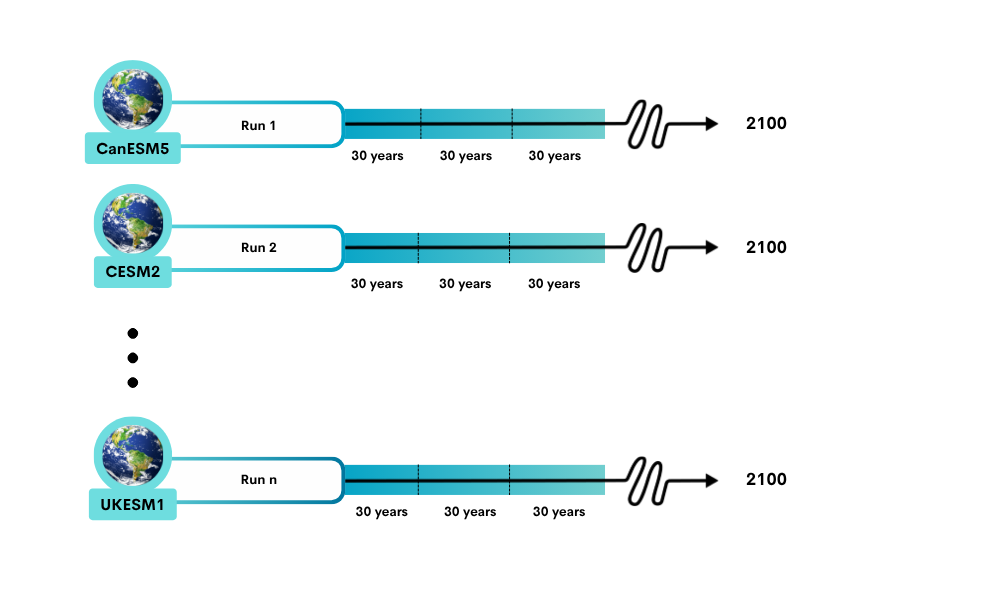
Climate projections are generated from an ensemble of global climate models (GCMs) for each emissions scenario. The different GCMs are run forward in time using historical, observed greenhouse gas concentrations, followed by future emissions scenarios. Using multiple simulations from an ensemble of climate models helps address uncertainty. Figure 7 shows an overview of an ensemble used to produce climate projections. Learn more about multi-model ensembles and percentiles in the Understanding Multi-Model Ensembles article.


Figure 7: Different models developed by climate modelling centres around the world are used to create an ensemble. The ensemble of simulations from different models is used to create climate projections. In the CanDCS-M6 ensemble, there are 26 different climate models except for SSP3-7.0, where only 24 of the 26 models were available.

Uncertainty

Seasonal forecasts and climate projections are affected by different sources of uncertainty, which impact how the datasets are presented and interpreted. Uncertainty should be considered when using seasonal forecasts and climate projections for decision-making and planning.

Seasonal Forecasts

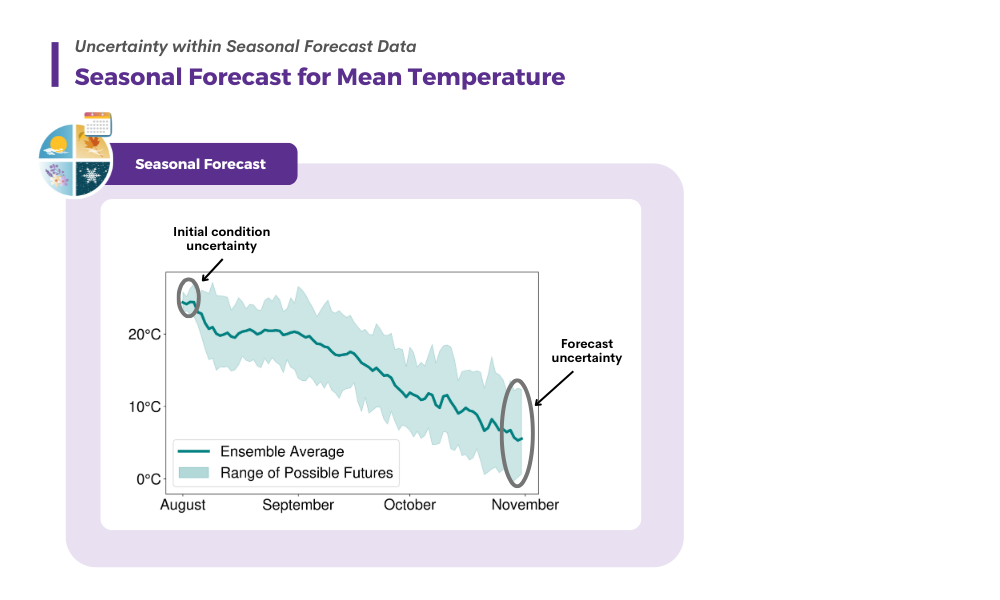
Most of the uncertainty in seasonal forecasts comes from constraints on the predictability of climate on seasonal time scales and limitations of the prediction system, with some uncertainty arising from inaccuracies in initial conditions. Performance metrics provide additional important context when evaluating seasonal forecasts. All forecasts include information on how well the seasonal prediction system performed over the historical reference period of 1991 to 2020. Figure 8 shows how uncertainty in the seasonal forecast is related to inaccuracies in the initial conditions and constraints on the predictability of climate.

The probability that a different outcome (e.g., above, near, or below normal) will occur should be considered in combination with the performance of the seasonal prediction system. The performance of CanSIPSv3 is measured using performance metrics, and changes depending on location, season, and how far into the future the forecast season is.


Figure 8: Seasonal forecast ensemble for mean temperature from August to October 2024 for a specific location, released on August 1st, 2024. The shaded teal area shows the temperatures predicted by each model simulation in the ensemble (within this shaded teal area are 40 different simulations), which gives the range of possible futures. The bold teal line is the ensemble average. One source of uncertainty in seasonal forecasts is inaccuracies in initial conditions. This uncertainty grows over the course of the forecast due to constraints on the predictability of climate on seasonal timescales.

Climate Projections

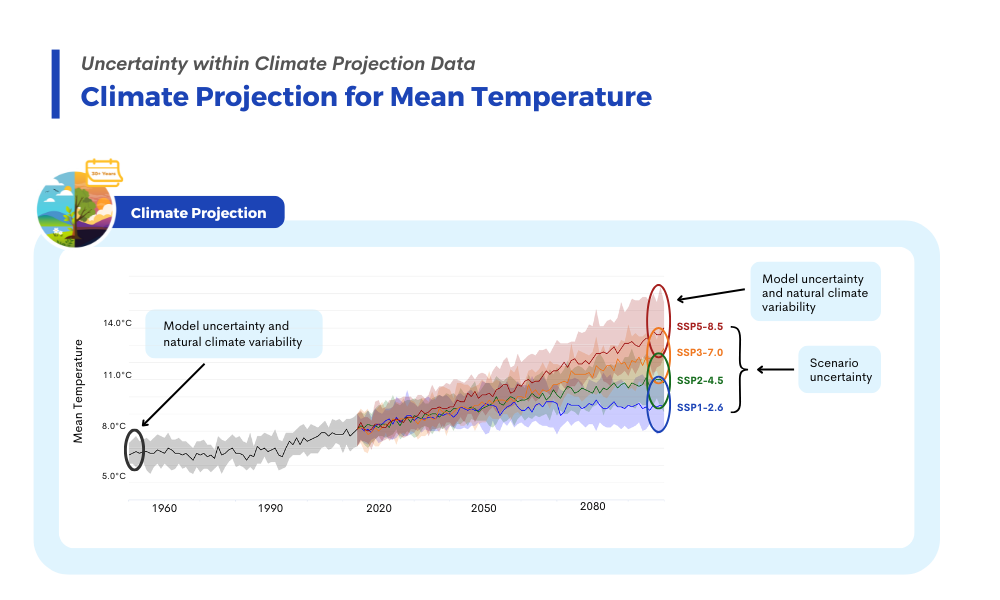
There are three main sources of uncertainty in climate projections: the emissions scenarios, the climate models themselves (e.g., how they each represent different climate processes) and natural climate variability. To show these uncertainties explicitly, climate projections are commonly shown for different emissions scenarios, as well as ranges within each emissions scenario. Figure 9 shows some of the main sources of uncertainty in climate projections. To learn more about how to consider uncertainty in climate projections, refer to this article.


Figure 9: Climate projections for mean temperature for a specific location until 2100 under four SSP emissions scenarios used in CMIP6; SSP1-2.6 in blue, SSP2-4.5 in green, SSP3-7.0 in orange, and SSP5-8.5 in red. The respective shaded areas for each emissions scenario show the model results that fall between the 10th and 90th percentiles of the ensemble. The respective bold lines for each emissions scenario show the 50th percentile of the ensemble. The range of results within each emissions scenario is due to model uncertainty and natural climate variability. The difference between emissions scenarios is the main source of uncertainty by 2100.

Where can I find more information?

Seasonal forecasts are coming to ClimateData.ca in 2025. The Learning Zone has more information on these forecasts including:

Climate projections can be accessed on ClimateData.ca. Visit the Learning Zone for more information.

References

  1. Diro, G.T., Merryfield, W.J., Lin, H., Lee, W.-S., Muncaster, R., Kharin, V.V., Parent, R., Swart, N., Seinen, C., Akingunola, D., Leung, V., Mansour, M., Chouak, M., Deng, X., Smith, G., Lemay, F., 2024. The Canadian Seasonal to Interannual Prediction System version 3.0 (CanSIPSv3.0). [pdf] Environment and Climate Change Canada. Available at: https://collaboration.cmc.ec.gc.ca/cmc/cmoi/product_guide/docs/tech_notes/technote_cansips_e.pdf [Accessed 1 November 2024].
  2. Kirtman, B., Power, S.B., Adedoyin, J.A., Boer, G.J., Bojariu, R., Camilloni, I., Doblas-Reyes, F.J., Fiore, A.M., Kimoto, M., Meehl, G.A., Prather, M., Sarr, A., Schär, C., Sutton, R., van Oldenborgh, G.J., Vecchi, G., Wang, H.J. 2013. Near-term Climate Change: Projections and Predictability. In: Stocker, T.F., Qin, D., Plattner, G.-K., Tignor, M., Allen, S.K., Boschung, J., Nauels, A., Xia, Y., Bex, V., Midgley, P.M., eds. 2013. Climate Change 2013: The Physical Science Basis. Contribution of Working Group I to the Fifth Assessment Report of the Intergovernmental Panel on Climate Change. Cambridge, United Kingdom and New York, NY, USA: Cambridge University Press. Ch.11.
  3. Merryfield, W.J., Baehr, J., Batté, L., Becker, E.J., Butler, A.H., Coelho, C.A.S., Danabasoglu, G., Dirmeyer, P.A., Doblas-Reyes, F.J., Domeisen, D.I.V., Ferranti, L., Ilynia, T., Kumar, A., Müller, W.A., Rixen, M., Robertson, A.W., Smith, D.M., Takaya, Y., Tuma, M., Vitart, F., White, C.J., Alvarez, M.S., Ardilouze, C., Attard, H., Baggett, C., Balmaseda, M.A., Beraki, A.F., Bhattacharjee, P.S., Bilbao, R., de Andrade, F.M., DeFlorio, M.J., Díaz, L.B., Ehsan, M.A., Fragkoulidis, G., Gonzalez, A.O., Grainger, S., Green, B.W., Hell, M.C., Infanti, J.M., Isensee, K., Kataoka, T., Kirtman, B.P., Klingaman, N.P., Lee, J.Y., Mayer, K., McKay, R., Mecking, J.V., Miller, D.E., Neddermann, N., Ng, C.H.J., Ossó, A., Pankatz, K., Peatman, S., Pegion, K., Perlwitz, J., Recalde-Coronel, G.C., Reintges, A., Renkl, C., Solaraju-Murali, B., Spring, A., Stan, C., Sun, Y.Q., Tozer, C.R., Vigaud, N., Woolnough, S., Yeager, S. 2020. Current and Emerging Developments in Subseasonal to Decadal Prediction. Bulletin of the American Meteorological Society, 101(6) pp. E869-E896. https://doi.org/10.1175/BAMS-D-19-0037.1.
  4. World Meteorological Organization. 2020. Guidance on Operational Practices for Objective Seasonal Forecasting. [e-book] Geneva: World Meteorological Organization. Available at World Meteorological Organization e-Library https://library.wmo.int/records/item/57090-guidance-on-operational-practices-for-objective-seasonal-forecasting [Accessed 3 June 2024].