Climate Data in Action: How do we expect climate change to impact the ski industry in Ontario?

Date October 13, 2026
Author Frances Delaney, Canadian Centre for Climate Services
Topics Climate Data in Action
Share this post

Introduction

Ontario’s ski industry is an important part of the province’s winter tourism economy and culture, attracting thousands of visitors each year to its resorts and trails. From the slopes of Blue Mountain to smaller local hills, downhill skiing and snowboarding contribute significantly to local economies. However, climate change poses challenges to the skiing industry in Ontario. Rising temperatures, shifting precipitation patterns, and shorter winter seasons have created uncertainty for ski resort operators, leading to shorter ski seasons, and an increasing need for artificial snowmaking.

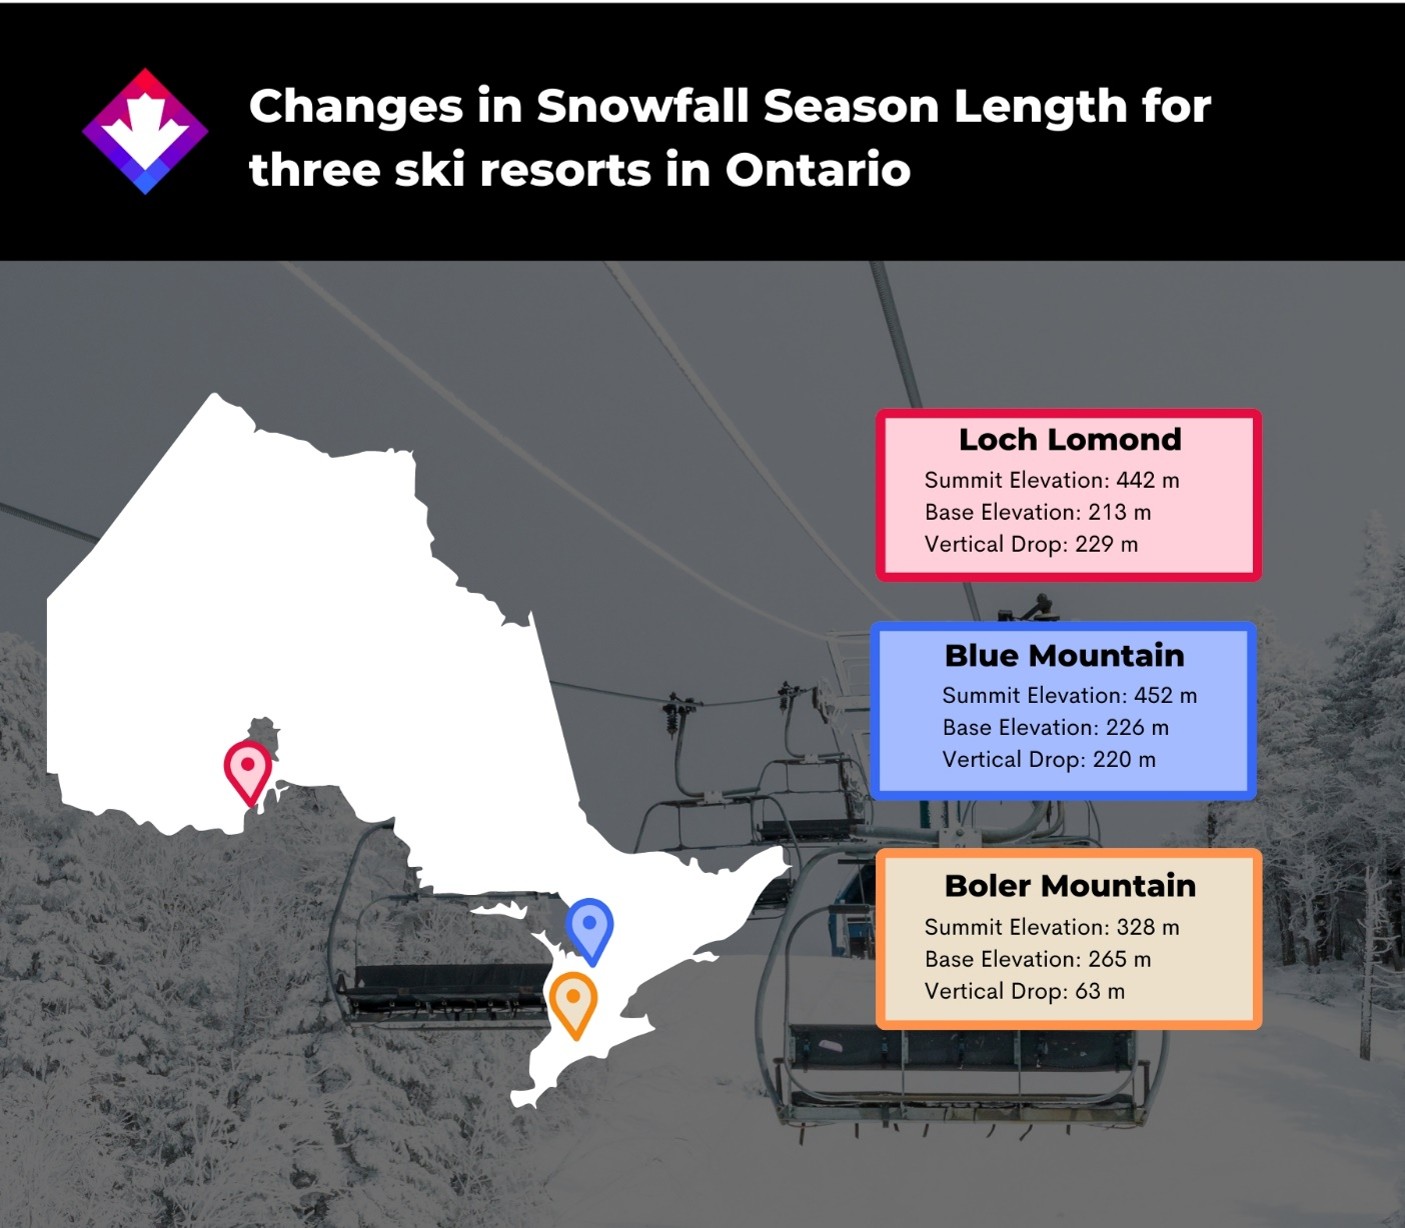
As climate change continues to alter winter weather patterns, understanding changes in future snowfall patterns in Canada can help inform long-term planning for the skiing industry. Recently, ClimateData.ca launched new snowfall projections for Canada. This article demonstrates how snowfall projections can be used to analyze changes in snowfall season length at Blue Mountain, Boler Mountain, and Loch Lomond ski resorts in Ontario.

Ready to use the snowfall projections? Click here to start exploring.

Snowfall Projections

ClimateData.ca’s new snowfall projections use daily precipitation and daily temperature to determine whether future precipitation will fall as rain or snow. The data is derived from simulations of daily total precipitation and mean daily temperature. More information on the methodology for developing this dataset can be found here.

A common way of expressing snowfall is using snow water equivalent, specifically the Height of New snowfall Water equivalent (HNW or water equivalent of snowfall). This represents the depth of water that would result from melting a newly fallen layer of snow.[1]

Snowfall projections, expressed as HNW, describe the following variables for all four emissions scenarios (SSP1-2.6, SSP2-4.5, SSP3-7.0, and SSP5-8.5) (click here to learn more about the SSP scenarios, including the latest article on the new emissions scenario, SSP3-7.0) from 1950-2100: 


Although these projections provide important information on how snowfall may change in the future, spatial and topographic limitations must be considered (please see Box 1).

For more information on this dataset, see:

Box 1: Considerations when using Long-Term Snowfall Data

Grid Cells vs. Point Location: The snowfall data on ClimateData.ca is resolved to grid cells of 10 km X 6 km. As such, data may differ from snowfall observations at a specific point location, especially if the region is topographically complex (e.g., if mountainous and lower-elevation terrain is located within a grid cell.)  

Snowfall vs Snowpack: Snowfall projections represent the amount of snow that falls within a 24-hour period. Snowpack projections represent the accumulation of snow on the ground over a season.

Ontario Ski Hills and Climate Change

In Ontario, snow resorts are facing uncertainty about future ski season lengths. Since snow resorts in Ontario are situated at lower elevations compared to ski resorts in western Canada, they rely heavily on snowfall at the ground level for their operations and cold temperatures for snow making.

For each ski resort, snowfall season length was evaluated using the number of days between the first and last days when snowfall is equal to or greater than 1 mm (inclusive). The absolute earliest first day is July 1st while the absolute latest last day is June 30th of the following year.

Blue Mountain

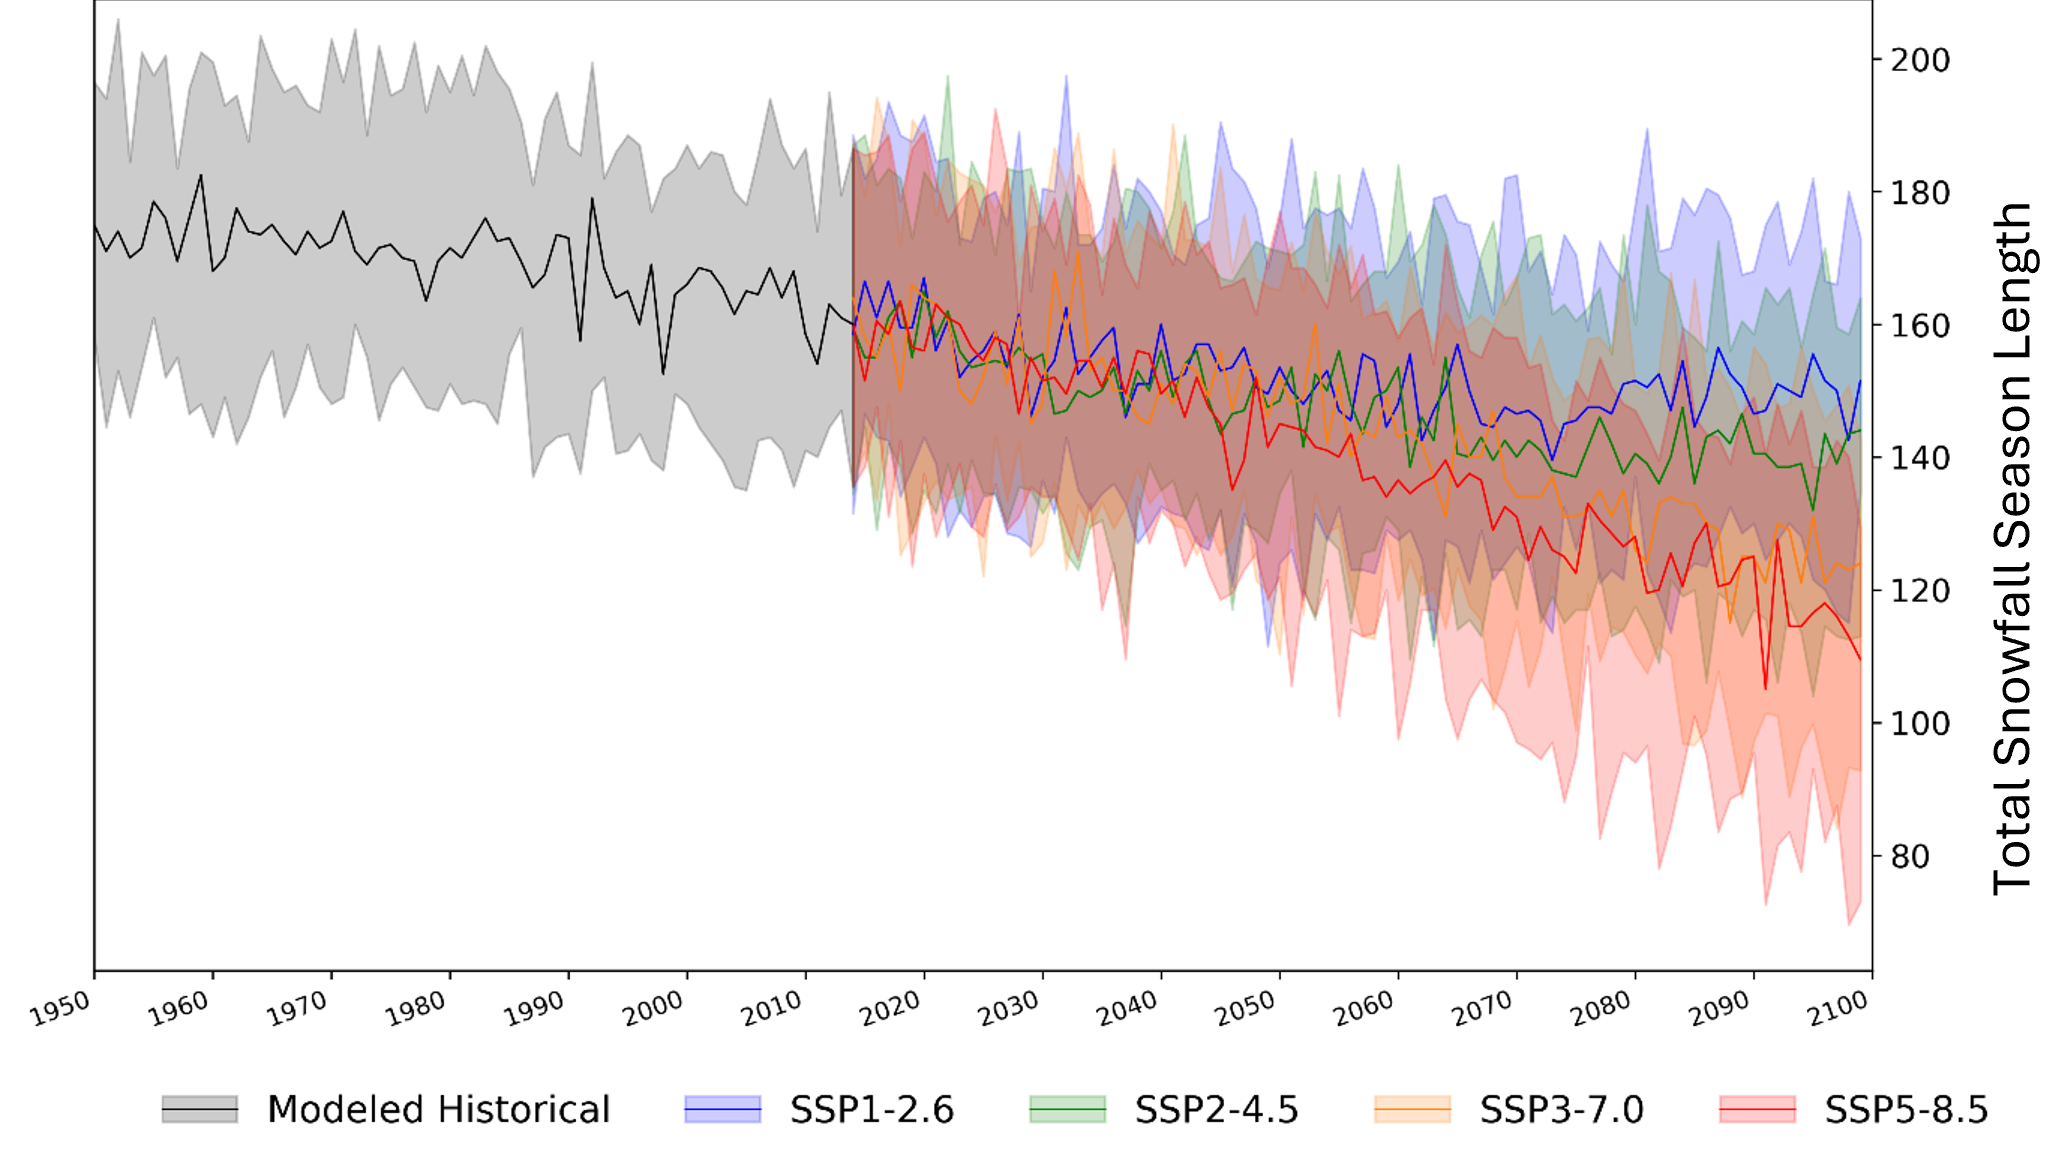
Blue Mountain Resort, located near Collingwood, Ontario, experiences long winters influenced by its proximity to Georgian Bay in Lake Huron. Figure 1 presents the modeled snowfall season length for the resort, based on an ensemble of climate models. For the 1971–2000 baseline period, the modeled snowfall season length is approximately 170 days.[2] In the following 30-year period (1991–2020), models indicate an average reduction in the snowfall season of about 7 days relative to that baseline.


Looking ahead, projections suggest that the snowfall season will continue to shorten:

  • Mid-century (2021–2050): A reduction of roughly 15 to 17 days compared to 1971–2000, resulting in a snowfall season of about 153–155 days. Differences between low- and high-emission scenarios are minimal at this time-horizon.
  • End of century (2071–2100): Larger differences between emission scenarios emerge at the end of the century. Projections range from 21 to 45 fewer days compared to the 1971–2000 average, corresponding to a snowfall season of about 122–149 days (roughly three to seven weeks shorter than the baseline period), depending on the emission scenario.


These modeled results illustrate how the length of the snowfall season at Blue Mountain is expected to decline, with the magnitude of change by the late century depending on future emission pathways.

Figure 1: The annual snowfall season length at Blue Mountain (44°30’12.41″ N, 80°18’43.67″ W; 44.375, -80.2917) from 1950-2100. The black line is the average of the modelled data (click here to learn more about modelled historical data: Modelled Historical Data — ClimateData.ca), and the four coloured lines represent shared socio-economic pathway (SSP) emissions scenarios. Blue represents the lowest emission scenario (SSP1-2.6), green the second lowest (SSP2-4.5), orange the second highest (SSP3-7.0), and red the highest emission scenario (SSP5-8.5). 

Boler Mountain 

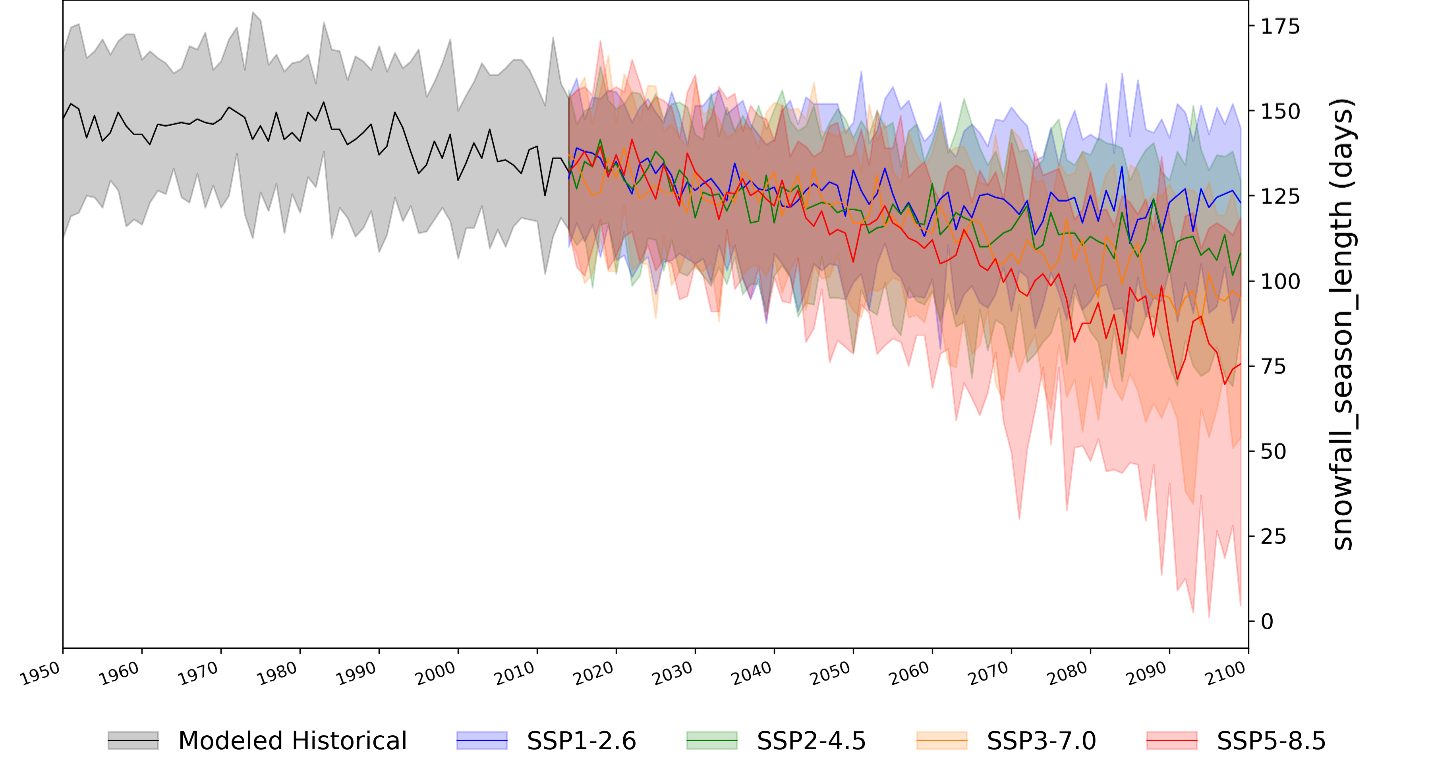
Boler Mountain, located in the “snowbelt” near London, Ontario, also experiences long winters, influenced by its proximity to the Great Lakes, specifically Lake Huron. Figure 2 presents the modeled snowfall season length for the resort, based on an ensemble of climate models. For the 1971–2000 baseline period, the modeled snowfall season length is approximately 143 days. In the following 30-year period (1991–2020), models indicate an average reduction of about 7 days in snowfall season relative to that baseline.


Looking ahead, projections suggest that the snowfall season will continue to shorten:

  • Mid-century (2021–2050): A reduction of roughly 15 to 18 days compared to 1971–2000, resulting in a snowfall season of about 125–129 days. Differences between low- and high-emission scenarios are minimal at this time-horizon.
  • End of century (2071–2100): Larger differences between emission scenarios emerge at the end of the century. Projections range from 20 to 51 fewer days compared to the 1971–2000 average, corresponding to a snowfall season of about 92–123 days (roughly three to seven weeks shorter), depending on the emission scenario.


These modeled results illustrate how the length of the snowfall season at Boler Mountain is expected to decline, with the magnitude of change by the late century depending on future emission pathways.

Figure 2: The snowfall season length for Boler Mountain (42°56’39.83″ N, 81°20’21.72″ W; 42.9583, -81.375) from 1950-2100. The black line is the average of the modelled data (click here to learn more about modelled historical data: Modelled Historical Data — ClimateData.ca), and the four coloured lines represent shared socio-economic pathway (SSP) emissions scenarios. Blue represents the lowest emission scenario (SSP1-2.6), green, the second lowest (SSP2-4.5), orange the second highest (SSP3-7.0), and red the highest emission scenario (SSP5-8.5).   

Loch Lomond

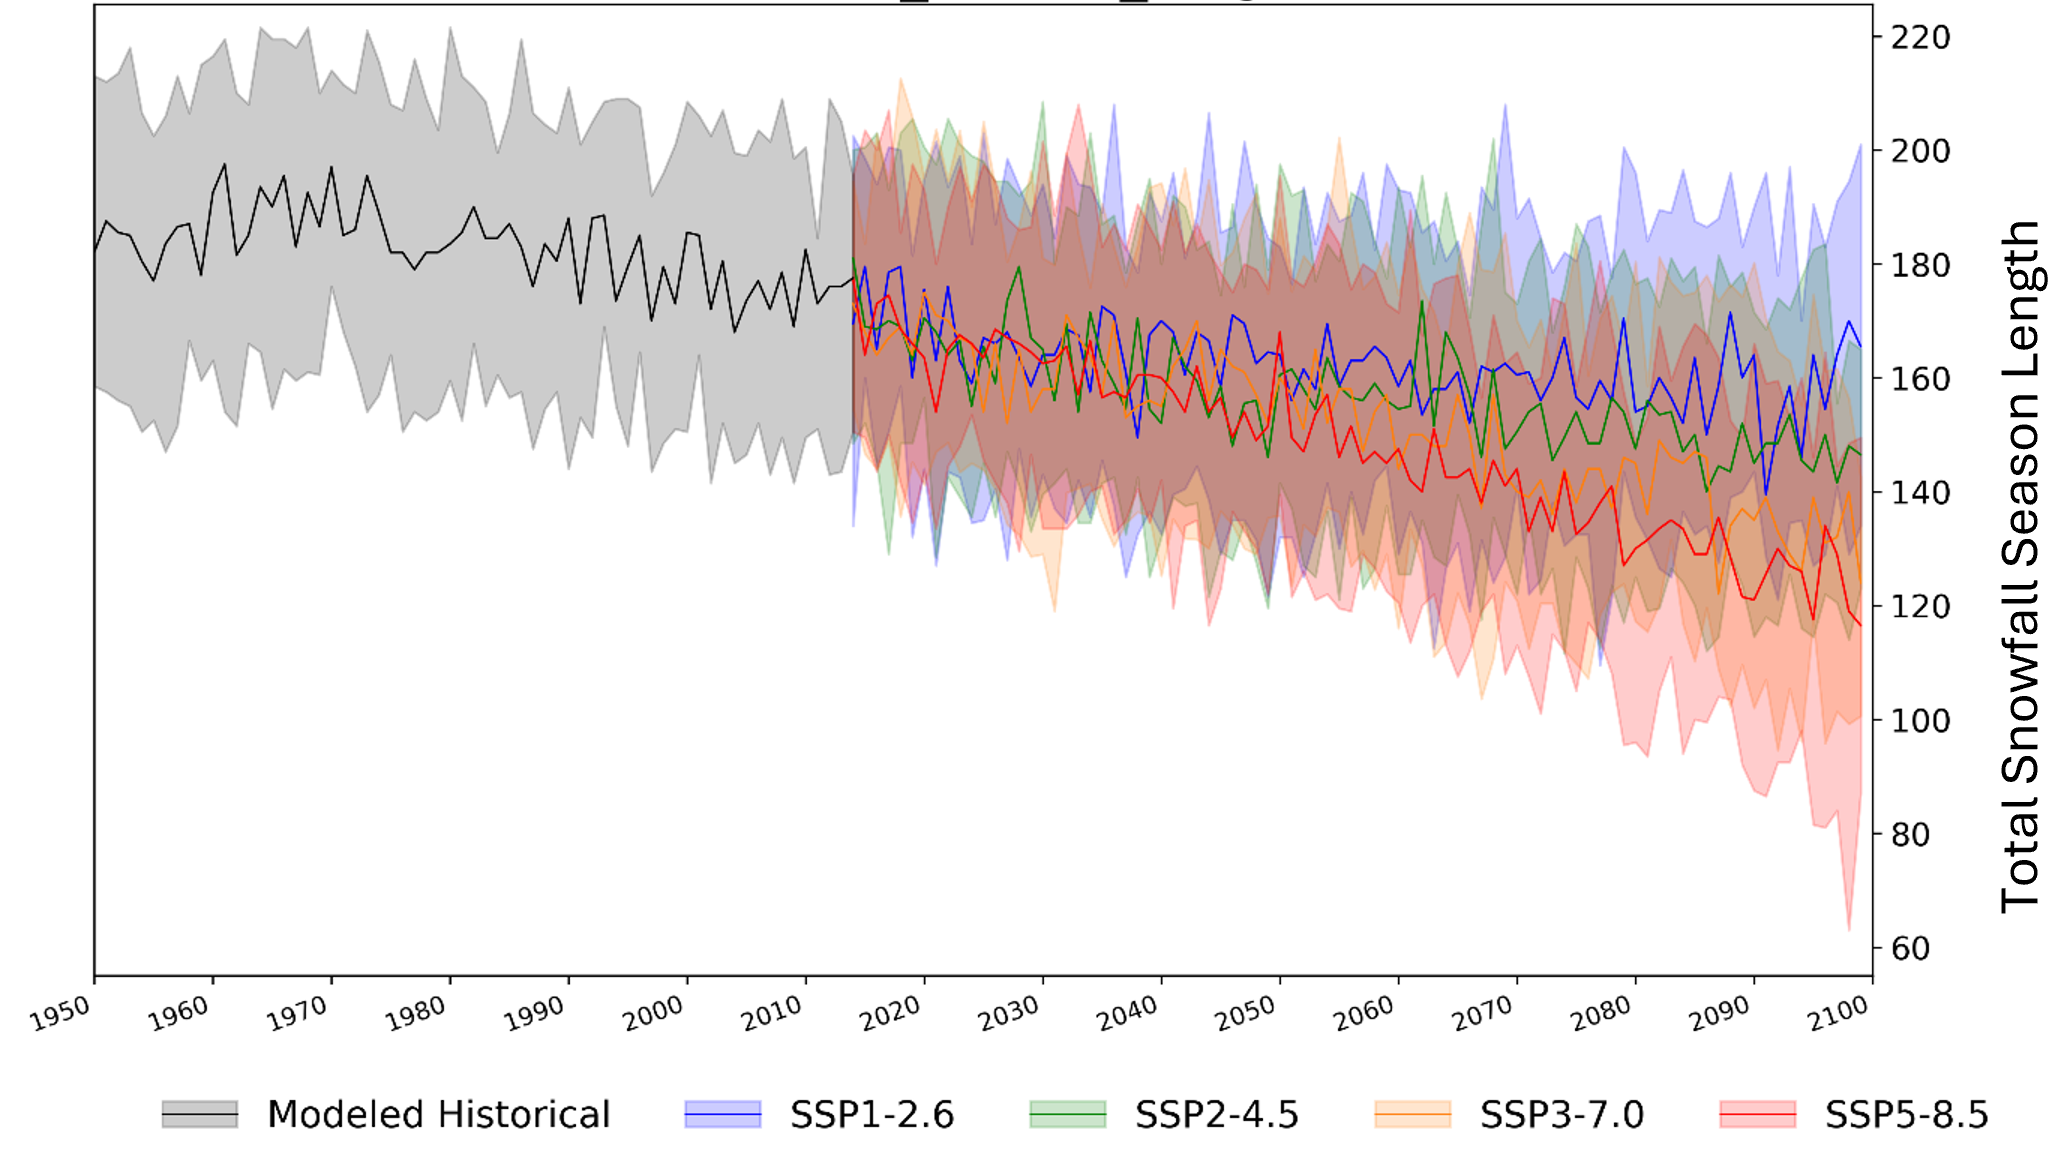
Loch Lomond Ski Area experiences long winters due to its northernly location and proximity to water, situated north of Loch Lomond and Lake Superior near Thunder Bay in northern Ontario. Figure 3 presents the modeled snowfall season length for the resort based on an ensemble of climate models. For the 1971–2000 baseline period, the modeled snowfall season length is approximately 182 days. In the following 30-year period (1991–2020), models indicate an average reduction of about 6 days relative to that baseline.


Looking ahead, projections suggest continued shortening of the snowfall season:

  • Mid-century (2021–2050): A reduction of roughly 16 to 21 days compared to 1971–2000, resulting in a snowfall season of about 162–166 days. Differences between low- and high-emission scenarios are minimal at this time-horizon.
  • End of century (2071–2100): Larger differences between emission scenarios emerge at the end of the century. Projections range from 22 to 48 fewer days compared to the 1971–2000 average, corresponding to a snowfall season of about 131–160 days (roughly three to seven weeks shorter), depending on the emission scenario.


These modeled results illustrate how the length of the snowfall season at Loch Lomond is expected to decline, with the magnitude of change by the late century depending on future emission pathways.

Figure 3: The snowfall season length of Loch Lomond (48°17’38.35″ N, 89°20’53.65″ W; 48.2917, -89.375) from 1950-2100. The black line is the average of the modelled data (click here to learn more about modelled historical data: Modelled Historical Data — ClimateData.ca), and the four coloured lines represent shared socio-economic pathway (SSP) emissions scenarios. Blue represents the lowest emission scenario (SSP1-2.6), green the second lowest (SSP2-4.5), orange the second highest (SSP3-7.0), and red the highest emission scenario (SSP5-8.5). 

Adapting to shorter snowfall seasons

Although all three of these Ontario-based ski resorts will likely face shorter snowfall seasons in the future, climate data helps explain the drivers of these changes (e.g., temperature vs. precipitation or both), which can be used to inform business and capital plans. For example, many ski resorts have explored the viability of investments in snowmaking equipment and diversification to year-round activities.

Snow-making technologies: In Ontario, there was a significant shift in snowmaking investments in the mid- to late-1980s in response to two poor ski seasons during the winters of 1979/1980 and in 1982/1983.[3] Now, almost all of Ontario’s ski resorts have snowmaking capabilities. There have been studies that demonstrate that by making snow, ski resorts can prolong their ski season lengths substantially. For example, in Scott et al. 2003, the authors noted that a small ski resort one hour north of Toronto (Horseshoe Ski Resort), extended its ski season by 33 to 830% during this time from its investments in snow making, when comparing snowfalls records or the nearest weather station to the snowfall depth at Horseshoe Ski Resort. The study shows that this resort can now open all of its ski runs with only five days of suitable temperatures for snow making per season. There are even snowmaking units that can operate above freezing temperatures (up to 17°C), which Boler Mountain has implemented already, Canada’s first ski resort to do so[4].

“[The positive temperature snowmaking unit] is capable of making snow at virtually any temperature… We’re in production right now, it’s a beautiful day, about 10 degrees (˚ C) out, and it doesn’t make tons of snow, but we’re out there producing snow at the very top where it’s most challenging for us to use our traditional production snow methods”

– Marty Thody (member of Boler Mountain’s management team)

Year-round activities: Resorts have also diversified their operations to attract visitors outside the ski season. Alongside winter activities such as snowshoeing, hiking, skating, and luge, many resorts now offer summer options like golfing, mountain biking, trampolining, rock climbing, and camps. These amenities, along with restaurants, shops, spas, and yoga studios, attract tourists. For instance, Blue Mountain Village has become a popular weekend destination for everything from hiking, shopping, relaxing, and bachelor and bachelorette parties. Many ski resorts in southern Ontario are investing time and money to diversify their resorts to ensure they are sustainable year-round[5].

Conclusion

Snowfall plays a crucial role in shaping Canada’s environment and our winter recreation activities. As climate change alters snowfall patterns, it is important to understand how these shifts will impact the recreational activities we care about.

Climate data can provide useful context for the skiing industry as it considers how to respond to a warming climate. Information on how snowfall seasons may change can help ski resorts in Ontario assess options such as investing in snowmaking or diversifying into non-skiing activities.

References

[1] Egli, L., Jonas, T. & Meister, Roland. (2009). Comparison of different automatic methods for estimating snow water equivalent. Cold Regions Science and Technology – COLD REG SCI TECHNOL. 57. 107-115. 10.1016/j.coldregions.2009.02.008.

[2] Values provided throughout this report represent the 50th percentile, i.e., the median of the ensemble.

[3] Scott, D., McBoyle, G., & Mills, B. (2003). Climate change and the skiing industry in southern Ontario (Canada): exploring the importance of snowmaking as a technical adaptation. Climate research, 23(2), 171-181.

[4] Simon, A. (2022). Boler Mountain unveils Canada’s first positive temperature snowmaking unit. Global News. Boler Mountain unveils Canada’s first positive temperature snowmaking unit – London | Globalnews.ca

[5] Palter, J., & Caraway, B. R. (2023). Understanding the approaches taken by private ski clubs in Southern Ontario to address climate change and sustainability. Journal of Outdoor Recreation and Tourism, 43, 100683.